
Page 30 - Acoustics Today Summer 2011
P. 30
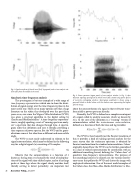
                                          Fig. 2. Power spectrum (upper panel) of one analysis window (v. Fig. 1) after Gaussian tapering; spectrogram of Somali word [bal] created using power spectra of successive overlapping windows. Spectrogram amplitude is shown using a grayscale linked to decibel values, with the darkest areas representing the highest spectral energy.
  Fig.1. Signal waveform of Somali word [bal] (top panel) and a 9 ms analysis win- dow taken from the middle of the vowel.
Quadratic time-frequency analysis
The spectrogram is but one example of a wide range of time-frequency representations which aim to show the distri- bution of signal energy over the time-frequency plane in the most useful way. There are so many options now that a huge literature on the subject has developed over the past thirty years or so, ever since the Wigner-Ville distribution (WVD) was given a practical algorithm in the digital setting by Claasen and Mecklenbräuker.2 A time-frequency representa- tion is, roughly speaking, a sort of “running spectrum analy- sis,” a spectrum that also changes through time. A spectro- gram takes this definition and uses it literally, providing a time sequence of power spectra. But the WVD and its gener- alizations come at this idea from a different and more subtle angle.
The WVD is most easily understood in relation to the signal autocorrelation, which may be defined in the following way for a digital signal s(n) consisting of N samples:
(1)
Observe that the autocorrelation is a function of l, known as the lag time; it is basically the result of multiplica- tions of the signal with time-shifted copies, and so it has large peaks at those lags where the signal closely matches itself, thereby serving to detect periodicity. An important fact
about the autocorrelation of a signal is that its Fourier trans- form yields a power spectrum directly.
Normally, the WVD is defined on a complex counterpart of a signal called its analytic associate, which we denote by z(n). At the core of the definition is a “running” version of autocorrelation called the instantaneous autocorrelation, defined as a function of both the time and lag variables:
(2)
The WVD is then basically just the Fourier transform of this; it provides a kind of running spectral analysis for the same reason that the stationary spectrum is obtained by Fourier transform from the standard autocorrelation. Cohen3 originally showed how the WVD can be further generalized to a class of related representations by convolution with an additional smoothing kernel, defining the “Cohen class” of quadratic time-frequency representations. The purpose of the smoothing kernel is to smooth out the various interfer- ence terms that pollute the WVD and clutter the image with unphysical information. One of the most useful examples of the Cohen class, the Zhao-Atlas-Marks distribution,4 is illus-
  26 Acoustics Today, July 2011
