
Page 31 - Acoustics Today Summer 2011
P. 31
trated in Fig. 3 as an alternative to the standard spectrogram for providing cleaner analyses of speech data.
Reassigned spectrogram
The STFT underlying the digital spectrogram is a grid of complex points in the time-frequency plane, each constitut- ing a magnitude and phase angle. The spectrogram itself is displayed using only the magnitude, converted to a decibel grayscale; the phase is discarded. However, there is much useful information in these STFT complex phases, which can be harnessed to compute the instantaneous frequency and precise time instant corresponding to the spectrographic grid points. Using this information, it is possible to reassign the points in a spectrogram to new locations in the time-fre- quency plane. A reassigned spectrogram can then be dis- played as a 3-D scatterplot showing all these points replotted in time and frequency, but using the original spectrographic magnitude. Once again it proves effective to display the mag- nitude dimension by means of a colormap.
The instantaneous frequencies of the signal components are determined from the time derivative of the STFT phase, while the correct time instants for each excitation are deter-
5
possible to extract yet more information from the STFT
phase, by computing the higher-order mixed partial deriva-
6
tives. These quantities can be used to determine whether a
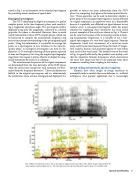
given point in the reassigned spectrogram is closely affiliated to a signal component, an impulsive event, or is dispensable because it is probably not affiliated to a signal element in any realistic sense. A reassigned spectrogram which has points removed by employing these derivatives has been called pruned; examples of the results are shown in Fig. 4. There it can be seen that, because of the increased precision in locat- ing instantaneous frequencies, it is valuable to use a reas- signed spectrogram of a very brief signal segment. Formant frequencies (vocal tract resonances) of a vowel are much more easily located and measured from this kind of “magni- fied” analysis, because such quantities appear to vary within each cycle of the vocal cords. The detailed view of the vowel in Fig. 4 is greatly affected by the speaker’s voice quality, such that the important formant frequencies which characterize the vocal tract shape now have to be separated from other resonances resulting from coupling to the trachea.
Speech coding and automatic speech recognition
Humans have often sought to design machines to accomplish tasks to emulate their own behavior, i.e., artificial intelligence. One popular application that is increasingly
These calculations are faithful to the original spectrogram, and so, unfortunately, the interference terms are also reassigned and displayed. It is
mined from the frequency derivative.
Fig. 3. Hindi word [bhana] shown with a spectrogram (upper panel) and a Zhao-Atlas-Marks image computed with the same analysis window length of 9 ms. The colormap runs from dark red (loudest) to green (quiet) in standard order.
Speech and Hearing 27
