
Page 11 - Volume 12, Issue 2 - Spring 2012
P. 11
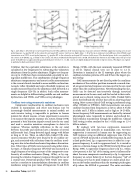
  Fig. 1. Left: Mean ± SE of the tip-to-tail Sound Pressure Level (SPL) difference of the stimulus frequency otoacoustic emission (SFOAE) suppression tuning curve at each probe frequency. Lp specifies SPL in the column for each equal-SPL contour (solid curves). Right: Mean ± SE of the tip-to-tail power-level difference of the SFOAE sound transmission curve (STC) at each probe frequency. Lp specifies SPL in the column for each equal-SPL contour (solid curves). The absorbed power level is row-specified for the contour at 50-dB SPL; e.g., at 4 kHz on this contour, the SPL is 50 dB and absorbed power level is 50 dB. The dashed lines between 4 and 8 kHz connect the tip-to-tail power level differences at approximately equal absorbed power levels of (± 1 ± dB). Curves are slightly displaced horizontally to improve clarity. [This figure was original- ly published in Keefe and Schairer (2011)]
It follows that the equivalent admittance at the eardrum is calculated at low frequencies by subtracting this volumetric admittance from the probe admittance. Higher test frequen- cies up to 1 kHz have been recommended, especially in test- ing infant middle ears. This combination of single-frequency admittance tympanometry and acoustic reflex measurements is the current clinical standard to assess middle-ear function. Acoustic reflex threshold and supra-threshold responses are usually measured based on the admittance shift detected at a single frequency (226 Hz in adults). Such reflex measure- ments are helpful in differentiating middle-ear and cochlear dysfunction, and VIIIth- and VIIth-nerve pathologies.
Cochlear tests using otoacoustic emissions
Compressive nonlinearities in cochlear mechanics were studied in mammalian and other non-human ears by increasingly detailed measurements in animal models, yet such invasive testing is impossible to perform in human patients for ethical reasons. A basic experiment in acoustics is to measure the impulse response of a system. Kemp (1978) presented a brief duration impulse sound into the ear canal and used a sensitive miniature microphone to detect its response. Whereas multiple reflections in the ear canal between the probe and eardrum have a duration of several milliseconds (ms), Kemp detected signal energy with delays as long as 12 ms. These so-called click-evoked (CE) otoa- coustic emissions (OAEs) were found to be of cochlear ori- gin, and associated with reflections from the cochlear travel- ing wave due to localized mechanical impedance discontinu- ities. Other types of OAEs were measured using other stimu- lus types. A stimulus-frequency (SF) OAE was measured at a single frequency by taking account of the compressive non- linearity of cochlear mechanics (Kemp, 1979a), or by sup- pressing the stimulus-frequency response through the use of a second tone. Distortion-product (DP) OAEs were meas- ured as a correlate to intermodulation distortion in cochlear mechanics using two pure tones of frequencies f1 and f2>f1
(Kemp, 1979b), with the most commonly measured DPOAE at 2f1-f2. Typical clinical tests use f2 close to 1.2 f1. Distortion is maximal at the f2 tonotopic place where the cochlear excitation patterns of f1 and f2 have the largest spa- tial overlap.
OAE measurements do not directly probe the nonlinear mechanics of the cochlear partition inasmuch as sound stim- uli are generated and responses are measured in the ear canal rather than the cochlear partition. Notwithstanding this fact, OAEs can be detected non-invasively through acoustical measurements in the ear canal, and this has led to their wide- spread use in clinical testing since the 1990s. Evoked OAEs assess the feedback role of outer hair cells in achieving sharp tuning. Most current clinical OAE testing is performed using either CEOAEs or DPOAEs. OAE measurements can assess cochlear function from frequencies as low as about 0.5 kHz in adults and 1.5 kHz in infants, and as high as 16-20 kHz. Lower-frequency OAE measurements are limited by internal physiological noise (especially in infants) and reduced for- ward stimulus transmission through the middle ear. Clinical OAE testing is often confined to the 1-4 kHz range or 1.5-4 kHz in infants.
By analogy with two-tone suppression measured mechanically and neutrally in mammalian ears, two-tone suppression is measured in human ears by suppressing an OAE response using an additional suppressor tone. For the case of a SFOAE measured at a fixed probe frequency, fp, and a fixed probe level, Lp, a suppressor tone is added at a sup- pressor frequency, fs, and its suppressor level, Ls, is varied to achieve a criterion change in the SFOAE level at fp (Brass and Kemp, 1993). A suppressor frequency close to fp (i.e., within a few percent) at the “tip” of the tuning curve is influenced by about the same compressive nonlinearity as fp. A suppressor frequency an octave below fp at the low-frequency “tail” of the tuning curve has its peak response at a more apical loca- tion on the basilar membrane than the tonotopic peak region of fp where the SFOAE is generated. The entire excitation
10 Acoustics Today, April 2012
