
Page 12 - Volume 12, Issue 2 - Spring 2012
P. 12
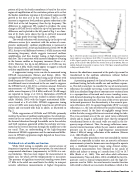
 Fig. 2. Distortion product otoacoustic emission (DPOAE) tuning curve based on mean suppressor sound pressure level (SPL) (±1 standard error) for f2 frequency of 6 kHz. Legend specifies the age group and the tip-to-tail pressure level for that group. Circles at f2 of 6 kHz represent the stimulus level L2 of 55 dB SPL. Plots are slightly displaced horizontally to improve clarity. [This figure originally published in Keefe and Abdala (2011)]
pattern of fp on the basilar membrane is basal to the active region of amplification of the excitation pattern at fs so that the basilar-membrane response at fp is linearly suppressed by growth in the tone at fs in the tail region. That is, a 1-dB increase in suppressor level produces greater reduction in the OAE level at the tail frequency than the tip frequency. The difference in suppressor SPL needed to produce the same change in SFOAE level is called the tip-to-tail pressure-level difference, and is plotted in the left panel of Fig. 1 as a func- tion of fp. Each curve shows the tip-to-tail level measured using a single probe level (Lp) (Keefe et al., 2008).
The overall reduction with increasing Lp in the tip-to-tail differences across fp is consistent with the action of a com- pressive nonlinearity: cochlear amplification is increased at lower stimulus levels. At low and moderate Lp levels (30-60 dB SPL), the tip-to-tail difference between 1-4 kHz increases with increasing frequency, which suggests increased cochlear amplification, and thus sharper tuning, at high frequencies than low. This is consistent with increased sharpness of tuning in the human cochlea as frequency increases (Shera et al., 2010). However, the tip-to-tail difference at 8 kHz was less than that at 4 kHz, which would appear to suggest a reduced cochlear amplification and broader tuning.
A suppression tuning curve can also be measured using DPOAE measurements (Brown and Kemp, 1984). The unsuppressed DPOAE is generated using a pair of tones with fixed frequencies (f1 and f2 ≈ 1.2 f1) and fixed levels, and then an additional tone is introduced in the ear canal to suppress the DPOAE level at 2f1-f2 by a criterion amount. Extensive measurements of DPOAE suppression tuning curves in adults across frequency (0.5-8 kHz) and level (50-dB range) are reported in Gorga et al. (2011). Maturation of DPOAE suppression tuning curves was studied in infants relative to adults (Abdala, 2001) with the largest maturational differ- ences found at a f2 of 6 kHz. DPOAE suppression tuning curves at 6 kHz were more sharply tuned in ears of full-term infants and six-month-olds than in adults, as illustrated in Fig. 2.
While suppression of SFOAEs and DPOAEs primarily involves the action of cochlear nonlinearities, the stimuli pre- sented in the ear canal to evoke the OAEs are transmitted in the forward direction through the middle ear to the cochlea, and OAE responses generated within the cochlear are trans- mitted in the reverse direction through the middle ear to the ear canal. Thus, an understanding of the high-frequency behavior of SFOAE suppression and the maturational differ- ences in DPOAE suppression might depend on these trans- mission pathways.
Wideband tests of middle-ear function
While OAE testing is available over several octaves of frequencies important to speech perception, the restriction of compensated admittance tympanometry to 226 Hz is a seri- ous limitation. This has most impact for measurements in infant ears, for which 226-Hz tympanometry is inaccurate. The presence of significant acoustical standing waves above 0.7 kHz in the adult ear canal limits the ability to interpret acoustic admittance measurements at higher frequencies,
because the admittance measured at the probe tip cannot be transformed to the eardrum admittance without further measurements and modeling.
A promising approach to clinical testing would be to use wideband testing for both middle-ear and cochlear respons- es. This led researchers to consider the use of aural acoustic reflectance for middle-ear testing. A one-dimensional sound field in an idealized long tube of constant cross-sectional area is a superposition of forward and reverse traveling waves, with forward denoting the direction from the sound source towards some discontinuity. The ratio of the reverse pressure to forward pressure at the discontinuity is the acoustic pres- sure reflectance, R(f). Its squared magnitude |R(f)|2 is energy reflectance, i.e., the ratio of reflected to incident energy from a transient sound. In the limit of negligible energy losses within the tube, energy reflectance is constant along the tube. The cross-sectional area of the ear canal varies sufficiently slowly and its length is sufficiently short that the integrated viscothermal losses at the canal walls are small in the fre- quency range of interest. Thus, the energy reflectance meas- ured at interior locations within the ear canal at ambient air pressure can be used as a high-frequency measurement (above 1 kHz) of energy reflectance at the eardrum (Stinson et al., 1982; Hudde, 1983).
Because earlier procedures were not intended for routine clinical use, especially in infant ears, an acoustic reflectance measurement system for human ears was designed to operate over a wideband frequency range using clinical eartips. Reflectance measurements were obtained in ear canals of adults and infants as young as 1 month from 0.125 to 10.7 kHz (Keefe et al., 1993). This and other adult reflectance measurements (Voss and Allen, 1994) straddled the low fre- quencies used in clinical tympanometry and the high fre- quencies used in OAEs. An aural acoustic transfer function well suited to clinical use is acoustic absorbance, which is the
Middle-ear and Cochlear Functions 11
