
Page 14 - Volume 12, Issue 2 - Spring 2012
P. 14
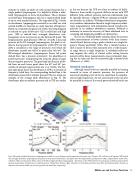
nometry in which an adult ear with normal function has a single-peaked tympanogram, it is helpful to define a wide- band tympanogram in terms of absorbance. This is because an absorbance tympanogram also has a single-peaked shape in an ear with normal function. The top panel of Fig. 5 shows an absorbance tympanogram recorded in an adult ear with normal middle-ear function as a joint function of frequency. Based on a transition frequency of 2 kHz, this tympanogram is reduced to a pair of low pass- (LP, in solid line) and high pass- (HP, in dashed line) averaged absorbance tym- panograms versus air pressure on the bottom left panel. The tympanometric peak pressure (TPP) of -20 daPa is the peak pressure of the LP-averaged tympanogram; this peak is evi- dent in the top panel. Its tympanometric width (TW) of 124 daPa is calculated as the range of pressures over which the absorbance exceeds one-half of its peak value (of 0.46). The HP-averaged absorbance tympanogram (lower left panel, dashed line), has a pressure asymmetry: the absorbance at positive pressures (compressing the ossicular chain) is larger than at negative pressures. The grey band and the pair of dot- ted lines on each lower panel show the 80th and 90th per- centiles of normal response from Liu et al. (2008). The bot- tom right panel shows the absorbance at TPP as a function of frequency (solid line); the corresponding dashed line is the absorbance measured at ambient pressure (this is a single-ear example of the average adult absorbance in Fig. 3). The absorbance plots at ambient pressure and at TPP are similar
in this ear because the TPP was close to ambient (0 daPa). However, these would, in general, differ in an ear with TPP different from ambient pressure and such information may be clinically relevant—negative TPPs are common in middle- ear disorders in children. Wideband absorbance tympanom- etry combines information found in single-frequency admit- tance tympanometry with information found at higher fre- quencies in an ambient absorbance response. Research is underway to assess the accuracy of these wideband tests in screening and diagnosing middle-ear dysfunction.
The use of a wideband probe stimulus allows for acoustic reflex measurements at lower activator levels than conven- tional clinical devices using a probe stimulus at a single fre- quency (Feeney and Keefe, 1999). This is mainly because a shift is easier to detect when measured over a wide frequen- cy range than at a single frequency. A wideband reflex test may improve the safety of clinical reflex testing because acoustic-reflex decay measurements cause permanent hear- ing loss in some ears due to excessively high activator levels (Hunter et al., 1999).
Absorbed sound power
Although sound levels are typically specified in hearing research in terms of acoustic pressure, the presence of acoustical standing waves in the ear canal leads to complica- tions at high frequencies. An ear-canal sound source can also be specified in terms of the sound power absorbed by the ear
  Fig. 5. Measured wideband absorbance tympanogram in adult ear versus frequency and tympanometric pressure (top). Low pass (LP, solid line) and high pass (HP, dashed line) averaged absorbance tympanograms are plotted versus pressure (bottom left). This panel shows the tympanometric peak pressure (TPP), tympanometric width (TW), minimum (Min) and maximum (Max) values of the LP-averaged absorbance tympanogram. Absorbance at the TPP is plotted versus frequency (solid line) along with the separate measurement of absorbance at ambient pressure (dashed line) (bottom right). The plots in the bottom panel also show 80th and 90th percentiles of adult-ear responses with normal middle-ear function (gray fill and dotted line, respectively).
Middle-ear and Cochlear Functions 13
