
Page 15 - Volume 12, Issue 2 - Spring 2012
P. 15
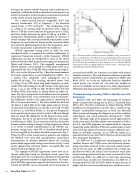
  Fig. 6. Distortion product otoacoustic emission (DPOAE) tuning curve based on ∆La (± 1 standard error), the difference in La and absorbed power level of the stim- ulus based on L2 and the mean conductance level at f1 and f2. Circles at f2 of 6 kHz and 0 dB show the normalization of each tuning curve to the absorbed DPOAE stimulus power. Plots are slightly displaced to improve clarity. [This figure origi- nally published in Keefe and Abdala (2011)]
as long as an acoustic transfer function such as admittance is measured. Calibration based on absorbed sound power is an attractive alternative to that based on sound pressure level for a wide variety of aural acoustical measurements.
For a mean-squared pressure magnitude |p(f)|2 and acoustic conductance G(f) at frequency, f, the absorbed
2
sound power is W(f )=G(f )|p(f )| . The conductance level
LG=10log10G in a normal adult ear increases with a slope of about 4.5 dB per octave from low frequencies up to 4.5 kHz, and then steeply decreases by about 20 dB up to 8 kHz. A conductance measurement makes it possible to construct a sound stimulus with constant absorbed sound power across frequency in a particular ear. Except for the case of the infant ear canal with additional power loss at low frequencies, near- ly all the sound power is absorbed by the middle ear.
SFOAE suppression tuning curves in adult ears were introduced earlier as a measure of cochlear nonlinearity at suppressor frequencies around a probe frequency. SFOAE suppression can also be interpreted in terms of the sound power absorbed at both the probe and suppressor frequencies (Keefe and Schairer, 2011). The originally unsuppressed SFOAE response was recorded at a fixed probe level Lp as indicated by the 30 to 70 dB SPL values shown on each equal- SPL curve on the left panel of Fig. 1. Based on measurements of acoustic conductance, LG was normalized to 0 dB for G=1 1 mmho (this commonly used audiological unit is mmho=10-8m4.s/kg). The resulting absorbed power level La=10log10W=LG+SPL varied with probe frequency as indi- cated by the values along the 50-dB contour in the right panel ofFig.1.e.g.,Lawas43dBat1kHz,50dBat4kHz,butonly 29 dB at 8 kHz, with similar LG-related offsets on other con- tours. The tip-to-tail pressure-level difference on the ordinate of the left panel of Fig. 1 was converted to a tip-to-tail power- level difference shown in the right panel by converting the SPL at the tip and tail into La. The lower dashed line between the data at 4 and 8 kHz on the right panel connects the tip- to-tail power-level difference at a probe La of 50 dB at 4 kHz to that at a La of 49 dB at 8 kHz; i.e., this pair of frequencies had equal absorbed power level to within 1 dB even though their ear-canal SPL differed by 20 dB. Based on these trans- formations, the tip-to-tail power-level difference was larger at 8 kHz than at 4 kHz. This is consistent with the theory that human cochlear tuning is sharper at high frequencies (Shera et al., 2010). A similar transformation of the DPOAE sup- pression tuning curve from SPL to absorbed sound power level was applied to the infant and adult responses in Fig. 2. When the SPLs of the stimuli used to generate and suppress the DPOAE were used with age-dependent conductance measurements to calculate absorbed power, the resulting power-based suppression tuning curves shown in Fig. 6 were nearly identical for full-term infants, six-month-olds and adults (Keefe and Abdala, 2011).
The example of SFOAE suppression shows how an in- the-ear calibration based on absorbed sound power has advantages over ear-canal pressure calibration in interpreting cochlear-generated responses at high frequencies. The exam- ple of DPOAE suppression supports the theory that the mat- uration of DPOAEs can be accounted for by maturation of
ear-canal and middle-ear function in an infant with mature cochlear mechanics. This and alternative theories of possible cochlear sources of maturation are explored in Abdala and Keefe (2012). An in-the-ear calibration based on absorbed sound power can control for ear-canal and middle-ear sources of variability across frequency in other physiological, behavioral and clinical measurements of auditory function.
Newborn hearing screening (NHS) to identify ears with hearing loss
Between 2000 and 2009, the percentage of newborn infants screened for hearing loss in the U.S. increased from 38% to 97%. The Joint Committee on Infant Hearing (JCIH) mandates screening infants at no later than 1 month of age, because “unidentified hearing loss at birth can adversely affect speech and language development as well as academic achievement and social-emotional development” (JCIH, 2007). The large scope of the program can be appreciated by the fact that over 3.9 million infants were screened in 2009 in the U.S., and NHS programs are implemented in countries around the world. Objective NHS tests include either or both of an OAE and auditory brainstem response (ABR) for new- borns in well-baby nurseries, or an ABR for infants in a neonatal intensive care unit (NICU) because of increased risk for a permanent hearing loss.
An ABR test is a peripheral neurodiagnostic test for cochlear disease and VIIIth nerve and brainstem disease. Using electrodes attached to the scalp and sound stimula- tion in the ear canal, an ABR is composed of a voltage sig- nal detected within the initial 15 ms of stimulus onset from a brief sound presented in the ear canal, as reviewed by Don and Kwong (2009). An ABR test is more time consuming and costly than an OAE test. Nevertheless, the ABR test is recommended by JCIH for NICU babies because they are at higher risk for sensorineural hearing loss, and because neu-
14 Acoustics Today, April 2012
