
Page 32 - Volume 8, Issue 4 - Winter 2012
P. 32
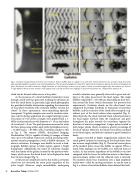
  Fig. 5. Cavitation cloud generated at the focus of a transducer. (Left) A bubble cloud as it appears in a water bath. (Center) Formation of a cavitation cloud observed by high-speed photography in a gelatin tissue-mimicking phantom. The ultrasound propagation is from left to right, and the cloud grows opposite this direction throughout the pulse. Shock fronts are visible as dark lines. (Right) Initiation of a cloud during 3 acoustic cycles of a pulse. A cluster of cavitation appears after the incidence of a shock on a single bubble at the focal center. Another cluster appears each cycle after the shock wave impinges on the previously formed one. (Adapted from reference 26).
cloud can be formed within one or a few pulses.
As the presence of a cloud facilitates histotripsy tissue
damage, much work has gone into studying the dynamics of
how this cloud forms. In particular, high-speed photography
has provided valuable information regarding the interaction
of the pulsed waveform with cavitation bubbles to form the
26
cloud. In these experiments, tissue-mimicking optically-
transparent 7% gelatin samples were used to visualize cavita- tion activity during application of a single histotripsy pulse. The pulses of 5-20 cycles in length were applied from a 1- MHz circular transducer with diameter d = 10 cm and radius of curvature F = 9 cm. The peak pressures measured in water for these pulses using a fiber-optic probe hydrophone were p- = 19 MPa and p+ = 85 MPa, with a waveform similar to that in Fig. 4. The camera (SIM02, Specialized Imaging, Hertfordshire, UK) is capable of taking 16 images at frame rates up to 100 million frames per second, providing infor- mation on pulse propagation as well as bubble dynamics. To observe cavitation, the images were backlit to create a shad- owgraph. Bubbles appear as black regions against a bright background. Additionally, the index of refraction changes with the density of the gelatin (created by the pressure wave- form), which causes the shock fronts to be displayed as dark lines in these images (Fig. 5).
At the pressure amplitude used in this study, a cavitation cloud was not observed for every pulse regardless of the pulse length. However, single microbubbles undergoing
inertial cavitation were generally observed to grow and col- lapse as the pulse passed over the focal region. The single bubbles expanded to ~100-200 mm, depending on their loca- tion around the focus (which determines the pressure they experienced). Cavitation clouds, on the other hand, were comprised of perhaps hundreds or thousands of cavitation bubbles, and the structure of the cloud often occupied a sig- nificant part of the focal volume when expanded (Fig. 5). Most distinctly, the cloud ‘initiated’ from a distal position in the focal region (furthest from the transducer) and grew throughout the pulse towards the transducer (against the direction of acoustic propagation). Longer pulses tended to form larger clouds which occupied a greater percentage of the focal volume. However, the clouds were always confined to the focal region, and did not continue to grow beyond its limits.
Images recorded at higher magnification indicate that cloud growth initiates by scattering of the shock fronts from one or more single bubbles (Fig. 5). The initial tension phase of the incident pulse causes this bubble to expand. When a shock front impinges on the bubble, it is reflected from its surface. As the acoustic impedance of the bubble is very low compared with the tissue, the reflection occurs as that from a pressure-release surface and the reflected wave is inverted. The incident shock thus transforms into a high amplitude tensile wave—ideal for inciting cavitation. As can be seen in Fig. 5, a cluster of cavitation bubbles forms behind this back-
28 Acoustics Today, October 2012
