
Page 41 - 2013 Spring
P. 41
Consumers listening to these loudspeakers will hear spa- tial and timbral aspects of the art very much as the creators did. Most of the irregularities in the curves are close to or below the thresholds of detectability, and are not likely to seriously detract from the experience (Toole and Olive, 1988). Very low bass output is somewhat lacking, and this small cone/dome system will not play as loud as the monitor. Bass management and subwoofers would address both prob- lems. However, larger, more expensive, domestic loudspeak- ers can perform in a manner that closely emulates the moni- tor. Sadly, price is not a reliable indicator of sound quality, and most manufacturers are reluctant to reveal useful speci- fications on their products, leaving consumers in an unfortu- nate circumstance. At present there is a standards group working on implementing the spinorama as a basis for loud- speaker specifications. However, it will be a voluntary stan- dard.
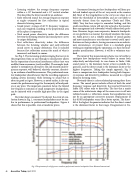
The intent of this measurement scheme was to be able to anticipate how loudspeakers would behave in rooms both subjectively and objectively. As was shown in Toole, 1986, sound power is the dominant factor at low-to-middle fre- quencies, and the direct sound is the dominant factor at the highest frequencies. Taking this simple approach, Fig. 5 shows a comparison for a loudspeaker having both frequen- cy response and directivity problems, measured in a typical domestic listening room.
Obviously there is a close relationship among these three curves. The sound power includes effects of both the axial frequency response and directivity, the inverted Directivity Index (DI) relates only to directivity. The fact that a major cause of the unfortunate shape of the room curve is off-axis radiated sound, i.e. reflections, means that equalization may not be an appropriate corrective measure. Replacement of this $10K loudspeaker seems like a better option. The short- fall at the highest frequencies indicates that the direct sound is the dominant factor in that range. Disagreement at fre-
• Listening window: the average frequency response within a ± 30° horizontal and ± 10° vertical window. This describes the direct sound for an audience.
• Early reflected sound: the average frequency response at angles estimated for first reflections in typical domestic listening rooms.
• Sound power: average of all 70 frequency responses, each one weighted according to the proportional area of the sphere it represents.
• Total sound power directivity index: the difference between the listening window and sound power curves (a unique definition).
• First reflections directivity index: the difference between the listening window and early-reflected sound curves (a unique definition). This is included because first reflections account for much of what is measured, and heard, in rooms.
See Fig. 3. The increasing spatial averaging that occurs in the progression from on-axis through to sound power allows for the separation of acoustical interference effects (not very audible) from resonances (easily audible). The example loud- speaker is exemplary in all respects: flat and smooth axial fre- quency response, well-behaved, relatively constant, directivi- ty, no evidence of audible resonances. This professional mon- itor loudspeaker should ensure that the recording engineer is making artistic decisions while listening to sound that is about as good as it gets. However, as noted earlier, it also rep- resents the performance target for the majority of loudspeak- ers at any price. The important consistent factor, the limited low-frequency extension of small inexpensive loudspeakers, can be imitated with a variable high-pass filter in the signal path.
But what about consumers? To disrupt the circle of con- fusion shown in Fig. 1, consumer loudspeakers must be sim- ilar in performance to professional loudspeakers. Figure 4 shows that this is possible, even at moderate prices.
Fig. 3 The spinorama for a high power cone/horn professional monitor loudspeaker. Data: Harman International.
40 Acoustics Today, April 2013
