
Page 42 - 2013 Spring
P. 42
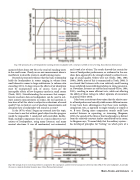
                                  Fig. 4 The spinorama for a well-designed floor standing domestic loudspeaker with a retail price of $329 at time of writing. Data: Harman International.
 quencies below about 200 Hz is the result of standing waves in the small room. Clearly an on-axis measurement alone is insufficient to describe events in small listening rooms.
Recently I presented evidence that this basic relationship holds for loudspeakers in rooms ranging in volume from small domestic rooms to large auditoriums (a volume ratio exceeding 100:1). In large venues the effects of air absorption must be incorporated and, of course, there are the inescapable effects of low-frequency modes in small rooms (Toole, 2012). Notwithstanding the assurance that compre- hensive anechoic data on loudspeakers can be used to esti- mate acoustic measurements in rooms, the real question is: how does all of this relate to subjective evaluations of sound quality? Can we look at a set of anechoic measurements and anticipate how a loudspeaker will sound in a room?
In the 1970s, when I began my research into this topic, it was clear to me that without good subjective data progress would be impossible. I conducted well-controlled, double- blind, multiple-comparison (four at a time) subjective eval- uations of loudspeakers, using many listeners, and many musical selections. It was all randomized, not automated,
 and it took a lot of time. The results showed that certain fea- tures of loudspeaker performance, as evidenced in the ane- choic data, appeared to be strongly related to subjective rat- ings of sound quality. Others were not (Toole, 1982, 1985, 1986a, 1986b, most of this is summarized in Toole, 2008). It was found that listeners with even relatively small hearing losses exhibited measurable degradation in rating consisten- cy. Nowadays, listeners are selected and trained (Olive, 1994, 2001), resulting in more efficient tests, while not affecting the ability of those ratings to reflect opinions of consumers in general (Olive 2003).
It has been a consistent observation that the relative mer- its of loudspeakers are basically stable across different rooms. It may have been advantageous that these were multiple- comparison tests, as opposed to single stimulus or simple A vs. B tests. Having more comparison sounds could have assisted listeners in separating, or streaming (Bregman, 1990), the sounds of the three or four loudspeakers as distinct from the relatively constant timbre contributed by the room. As Bregman says, “It seems likely that the auditory system... has developed principles for “betting” on which parts of a
  Fig. 5 The average of six in-room measurements is compared to the sound power, and the inverted sound power directivity index (DI) for the same loudspeaker. Acoustically the room is a typical, furnished, domestic space. Data: Harman International.
Music, Rooms, and Listeners 41
