
Page 16 - Fall2013
P. 16
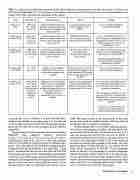
 Table 1. A summary of studies that estimated school-age hearing loss using national survey data. Percentages in Niskar et al. (2001) and Shargarodsky et al. (2010) represent an estimate of prevalence in the United States; Percentages in Schlauch and Carney (2011,2012) represent the percentage of the sample.
Study
NHANES data
Selection Criteria
Method
Findings
Niskar et al. (2001)
1988-1994 (N = 5249) ages 6-19
Required normal middle-ear function, complete audiometric data, and no ear drainage at the time of the test
Counted audiograms with high-frequency notches (HFNs)
12.5% of children had HFNs, consistent with NIHL
Schlauch and Carney (2011)
1988-1994 (N = 5089) ages 6-19 + simulation
Required normal middle ear function, complete audiometric data and no ear drainage at the time of the test
Computer simulations of
“flat” audiograms used to estimate false-positive HFNs
7 -10% of simulated children had HFN audiograms (depending on the assumptions) compared with 7.7% of children aged 6-11 and 14.9% of children aged 12-19
Schlauch and Carney (2012)
1988-1994 N= 134, ages 6- 11; N=175 ages 12-19
Required normal middle ear function, complete audiometric data and no ear drainage at the time of the test
Each child tested twice and audiograms a veraged before applying notch criteria
No notches observed in the young group (6-11); 6.3% of children in the older group (12-19) had HFNs
Averaging audiograms improves precision (reduces false positive identification of NIHL)
Shargadrodsky et al. (2010)
(N = 1951) ages 12-19
Children with incomplete audiometric data, ear pain, and cochlear implants were excluded
Calculated pure tone averages to identify low-frequency and high-frequency (HF) hearing loss (average threshold > 15 dB HL)
1 in 5 teens have hearing loss; 16.4% have HF hearing loss
Schlauch and Carney (2012)
1988-1994 & 2005-2006 Ages 6-19 (all of the children from both cohorts of NHANES studies)
Examined selected (excluded children with possible middle and external ear problems, earaches and impacted ear wax) and unselected (criteria identical to those of Shargardsky et al.) groups of children
Estimated the percentage of children with HF and low frequency hearing loss using Shargorodsky et al.’s criteria
6% of selected (otologically normal) teens (NHANES 2005-2006) found to have HF hearing loss (with no low- frequency component)
18% of a group of children 6-8, who have no risk factors for NIHL, have HF hearing loss, even after excluding children with abnormal middle-ear function
15 dB HL is too low of a pass-fail criterion for boundary between normal hearing and hearing loss
          sis found that 12.5% of children 6-19 years old had HFNs. Children were divided into two age groups, 6-11 year olds and 12-19 year olds, and the prevalence rate of these notched audio- grams was 8.5% and 15.5% in the younger and older children, respectively.
Shargorodsky et al. (2010) analyzed a more recent sample of NHANES data collected between 2005-2006 (http://www.cdc.gov/nchs/nhanes/nhanes2005- 2006/nhanes05_06.htm) for 12-19 year olds and replicated Niskar et al.’s finding of a high percentage of notched audio- grams. They also reported the prevalence of high-frequency hearing loss (average thresholds for 3, 4, 6 and 8 kHz) – a new metric - and found that that between 1988-1994 and 2005-2006 this prevalence increased in teens. Shargorodsky et al. found that 1 in 5 teens in the more recent sample of NHANES data have hearing loss. They suggested that the higher prevalence of hear- ing loss in the more recent survey could be a result of noise exposure related to the use of personal stereo devices, such as
iPods. They urged caution in the interpretation of their data because they could not establish causality with their methods nor did they rule out conductive hearing loss.
Despite Shargorodsky et al.’s cautions, following publica- tion of their study newspaper headlines and television broad- casts around the United States led with the news that 1 in 5 teens has hearing loss and that the loss may be linked to exposure from personal stereo devices. A Google search of “1 in 5 teens” and “hearing loss” found 12,900 results, nearly all of which are related to Shargorodsky et al.’s study. This 20% prevalence figure is higher than the 12-15% cited by the NY Times article summarized in ECHOES. These percentages could be related to the percentage of notched audiograms found in the earlier study by Niskar et al. At the time my arti- cle was submitted to Acoustics Today (August, 2013), a CDC website (http://www.cdc.gov/healthyyouth/noise/index.htm) claims that 12.5% of school-age children have NIHL. The CDC cites Niskar et al. (2001) for this statistic.
Hearing Loss in Teenagers 15
