
Page 17 - Fall2013
P. 17
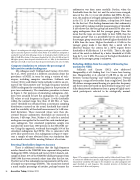
  Figure 1. An audiogram with a high-frequency notch typical of a person with hear- ing loss caused by exposure to intense sound. Niskar et al. labeled an audiogram as notched if it met all of the following criteria: 1) thresholds at both 0.5 kHz and 1.0 kHz of 15 dB HL or better; 2) the poorest threshold at 3.0, 4.0 or 6.0 kHz at least 15 dB higher (poorer) than the poorer threshold at 0.5 or 1 kHz; 3) the threshold at 8 kHz had to be 10 dB or more lower than the poorest threshold at 3.0, 4.0 or 6.0 kHz.
Computer simulations to estimate the percentage of false-positive notched audiograms
My colleagues and I (Schlauch and Carney, 2011,2012; Jin et al., 2013) arrived at a different conclusion about the prevalence of NIHL in teens by using a variety of tech- niques, including computer simulation. Schlauch and Carney (2011) used Monte Carlo methods to derive an esti- mate of the “false positive rate” for high-frequency notched (HFN) audiograms by considering limits in the precision of pure tone audiometry. The simulation procedure is shown in Figure 2. For purposes of simulating audiograms, chil- dren were assumed to have flat audiograms (i.e., equal dB HL values at each frequency in Figure 1) with thresholds within the normal range (less than 15 dB HL). A “mea- sured” threshold was obtained from a continuous sampling distribution centered on the actual threshold that consid- ered the variability of threshold measurement (a 5-dB stan- dard deviation). These measured values were then dis- cretized because audiometric thresholds are measured in discrete, 5-dB steps. Next, Niskar et al.’s rule for a notched audiogram was applied to the result for each simulated per- son’s audiogram. Our simulated population sample size matched the more than 1000 persons in the NHANES sur- vey. Using this approach, we found that roughly 10% of the simulated audiograms had HFNs. This is consistent with a10% false-positive rate. The audiograms in Figure 3 repre- sent a sample of ones obtained from our simulation that were found to have HFNs meeting Niskar et al.’s criteria.
Retesting Thresholds to Improve Accuracy
There is additional evidence that the high-frequency notches found in the NHANES data represent false positive findings for NIHL. Schlauch and Carney (2012) found a sub- sample of about 10% of the NHANES child participants from 1988-1994 that were retested a short time after the first test. The first test of this subsample was representative of the over- all sample in its percentage of HFNs. The second test showed a much smaller percentage of notches, perhaps because the
audiometry was done more carefully. Further, when the thresholds from the first test and the retest were averaged, none of the 134, 6-11 year old children had HFNs. By con- trast, the analysis of averaged audiograms yielded 6.3% HFNs in the 175, 12-19 year old children, a drop from 16% found for the first test. This finding demonstrates that audiometry is improved by making multiple measurements of threshold. It also shows that the teen group had more HFNs after aver- aging audiograms than did the younger group. Does this mean that the teens are more likely to have NIHL than the younger group? That is a possibility but we also found that the younger group consistently showed higher thresholds for 8 kHz than the teens. Higher thresholds at 8 kHz in the younger group make it less likely that a notch will be observed because the criteria for a HFN require better thresholds at 8 kHz than at 3, 4 or 6 kHz. That is, the right side of the notch is defined by a better threshold at 8 kHz than for 3, 4 or 6 kHz. The cause of the higher thresholds at 8 kHz in the younger group is unknown.
Excluding children from the sample with hearing loss unrelated to NIHL
Schlauch and Carney (2012) also addressed Shargorodsky et al.’s finding that 1 in 5 teens have hearing loss. Shargorodsky et al. selected 15 dB HL as the cut off between “normal hearing” and “mild hearing loss.” Normal hearing is a range of levels rather than a single level. Zero dB HL defines average normal hearing at a particular frequency, and these norms are based on data obtained using very care- fully administered audiometry from a group of highly moti- vated participants selected to be otologically normal.
  16 Acoustics Today, October 2013
Figure 2. The computer simulation procedure used by Schlauch and Carney (2011) to estimate the likelihood of spurious, high-frequency notched audiograms due to measurement variability. The input to the simulation was a flat audiogram with equal thresholds at each frequency. The standard deviation of threshold was assumed to be 5 dB at each frequency.
