
Page 22 - Spring 2015
P. 22
The Underwater sound field from Impact Pile Driving and Its Potential effects on Marine life
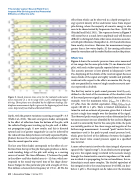
Figure 3. Sound pressure-time series for the radiated underwater noise measured at a 12-m range from a pile undergoing impact driving. Three phases are identified by the different shadings. Hy- drophone measurement depth is given at the beginning of each time series. Reprinted from Dahl and Reinhall (2013).
depth, with the greatest variation occurring at range/R*= 0.5 (Dahl et al., 2012). The next area (green shade) corresponds to the effect of reflection from the bottom of the pile, with the reflected bulge now traveling up the pile wall. A differ- ent propagation angle, θ, now results, and this is directed upward and is of greater magnitude (as can be inferred by the reduced time delays between vertically separated hydro- phones) because the sound speed in the sediment is higher than the sound speed in water.
The last area (blue shade) corresponds to the effect of a re- flection from the top of the pile that again produces a down- ward-traveling bulge of the pile wall acting as a moving source of sound. The time difference, T, between the peaks in the yellow- and blue-shaded areas is ~12.6 ms, which cor- responds to the round-trip travel time of the shape distur- bance (bulge) for this particular pile with a length of 32 m. This defines a characteristic frequency of 1/T or ~80 Hz, the
effect from which can be observed in a depth-averaged en- ergy spectral density of the underwater noise from impact pile driving, where the majority of acoustic energy is also seen to be characterized by frequencies less than ~2,000 Hz (Reinhall and Dahl, 2011). The sequence shown in Figure 3 will repeat but at a much lower amplitude and will become difficult to distinguish from other noise emissions associat- ed with pile vibrations (Zampolli et al., 2013) and reflections from nearby structures. However, for measurement ranges greater than a few water depths, H, the ensuing reflections from the sea surface and the seabed further confuse the picture.
Metrics
Figure 4 shows the acoustic pressure-time series measured at two ranges for the same pile strike (76-cm-diameter steel pile), with such strikes typically repeated about every 1.5 s. The acoustic pressure is here plotted in kilopascals (1,000 Pa), displaying all the details of the received signal; because many details of the signal are highly variable and probably irrelevant with respect to the effects on marine life, the sig- nals are quantified in terms of single-number acoustic met- rics expressed in decibels.
The first key metric is peak sound pressure level (Lp,peak), defined as the level of the maximum of the absolute value of the sound pressure signal in a specified time interval. For example, were the maximum value, |ρ|max, be 1 kPa (i.e., 109 μPa), then the decibel equivalent, 20log10(|ρ|max/ρref), equals 180 dB re 1 μPa. There is limited information re- tained in such an estimate of pressure, given that it is based on just a single time sample over the duration of the signal. The observed peak sound pressure values determined at the two measurement sites are identified by the circles in Figure 4, and it is noteworthy that for the same pile strike, the peak was initially positive at the closer range and negative at the farther range measurement. A second “peak” metric that is sometimes used is the peak-to-peak sound pressure level, which gives the level of the difference between the highest and the lowest value sound pressure signal in a specified
time interval.
A more robust metric involves the time integral of pressure squared (the “signal energy”). In an ideal acoustic propagat- ing wave, this signal energy is related to the acoustic energy through the characteristic acoustic impedance of the medi- um in which it is propagating, but in real conditions, this re- lationship is much more complex. The decibel equivalent of this integral result is the sound exposure level (SEL) in deci- bels re 1 μPa2∙s. The integral can be taken over the duration
20 | Acoustics Today | Spring 2015
