
Page 51 - 2016Spring
P. 51
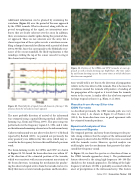
Figure 11. Position of the CPEG and STW tornados at near ap- proach as well as beam-forming rays (light blue). The time values
 Additional information can be gleaned by examining the waveform (Figure 10) over the period of the near approach by the CPEG tornado. What is observed, along with the ex- pected strengthening of the signal, are intermittent noise bursts that are clearly coherent over the array. In addition, there are numerous smaller spikes during the period of clos- est approach. These are not coherent over the array, but a closer inspection of these spikes reveals a waveform resem- bling a damped sinusoidal oscillation with a period of about 200 to 300 Hz. Since this corresponds to the Helmholtz reso- nance of the sensor manifold, the likely explanation is that raindrops striking the top of the sensor caused it to ring at this characteristic frequency.
  Figure 10. Waterfall plot of signals from all elements of Array 1. The distance from the tornado increases upward.
  The most probable direction of arrival of the infrasound was estimated using a spatial filtering method called beam forming (e.g., Krim and Viberg, 1996). This processing was performed over the frequency region 0.5–3 Hz, and it relies on the infrasound remaining coherent over the infrasound array.
Coherent infrasound was not observed in the 0.5–2 Hz band reported by Bedard (2005). As pointed out previously, the array geometry was different for this array, which may ac- count for he discrepancy between this and Bedard’s previous work.
The beam-forming results for CPEG and STW are shown in Figure 11. We found the beam direction was within 10° of the direction of the estimated position of the tornado, which was consistent with our measurement uncertainty of the beam direction. Assuming the mechanism for produc- ing the observed signal arrives from the tornado vortex, it is likely that more accurate tornado positions and beam direc-
by each beam-forming ray are the center times at which the beam direction was computed.
tions would yield a net bias in the direction of propagation relative to the true direct of the tornado. This is because the circulation around the tornado will produce a bending of the propagation of the signal as it travels from the tornado vortex to the sensor. A similar effect has also been reported for large tropical cyclones (e.g., Blom, et al. 2014).
Results from Array 2 for the
CBN Tornado
As described previously, the CBN tornado path was very close to Array 2. As shown in Figure 16 of Frazier et al.
(2014), the beam directions were in good agreement with the estimated tornado positions.
Spectral Analysis of the
Infrasound Signals
The temporal patterns and array beam-forming results pro- vide strong evidence that the origin of the infrasound and low frequency observed in the NCPA arrays were associated with the tornadic vortex. However, spectral analysis can yield insights into the mechanisms that generate this infra- sound/low-frequency sound.
In Figure 12, we show the spectra as a function of time as the CPEG tornado approaches Array 1. The predominant feature observed is the rising high-frequency (80–100 Hz) shoulder as the tornado approaches. The lifting of the high- frequency tail above 150 Hz is probably associated with the onset of precipitation at the infrasound array. This feature
Spring 2016 | Acoustics Today | 49
