
Page 52 - 2016Spring
P. 52
Infrasound from Tornadoes
is seen across all results. For the STW and CBN tornados, the shoulder diminishes as the tornado moves away from the arrays. Furthermore, during the interlude between the CPEG and STW tornados, this high-frequency shoulder is conspicuously absent (the high-frequency tail thought to be associated with precipitation is still present however).
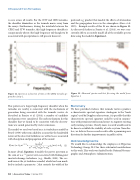
Figure 12. Spectra as a function of time as the CPEG tornado ap- proaches Array 1.
This pattern of a larger high-frequency shoulder when the
tornados are nearby is consistent with the mechanism of
generation being associated with the tornadic vortex. As
described in Frazier et al. (2014), a number of candidate
peak and a ga product that models the effects of attenuation and the propagation losses in the atmosphere (Bass et al. 1995). Example results of this fit are shown in Figure 13. As discussed further in Frazier et al. (2014), we were con- sistently able to accurately model all of the available spectra data using the model in Equation 1.
Figure 13. Measured spectra and best fits using the model from Equation 1.
Summary
We have provided evidence that tornado vortices produce a characteristic spectral signature. Analogous to the “hook region” used by Doppler radar systems, it is possible that this characteristic spectral signature could be used in conjunc- tion with permanent infrasound arrays to augment existing early warning systems. Clearly, more research would need to be done to establish the viability of such a system. Nonethe- less, we believe these research results offer a promising new direction for further improvements in public safety.
Acknowledgments (1)
We would like to acknowledge the employees at Hyperion Technology Group, LLC for their substantial contributions to this work. This work was funded by the National Oceano- graphic and Atmospheric Administration.
(1)
€
50 | Acoustics Today | Spring 2016
mechanisms were considered. The only mechanism for this
Equation 1 from Talmadge article:
shoulder that we found to be consistent with the observa- tions was sound generated by vortex emissions.
The model we used was based on a jet turbulence model by
Powel (1959) with terms added to account for the bandwidth
(1)
In more detail, Equation 1 models the power spectrum as
the sum of a ω–7/3 power term associated with Kolmogorov
nature of the observed turbulence as well as losses associated
Equation 1 from Talmadge article:
with absorption and propagation of the sound
22
S(ω,r)= Afω−7/3+ Asωnω ga(ω,r)+An
ω 4 + 4 ζ 2 ω n2 ω 2 + ω n4
inertial-subrange turbulence (e.g., Shields, 2005). The sec-
A ω2ω2
ond term is the−je7t/3turbulencesmnodel, which has been modi-
S(ω,r)=Afω +
fied to include a paramωet+er4ζ tωhatωco+ntωrols the width of the
4 2
2 2 4 ga(ω,r)+An nn
€
