
Page 36 - 2016Summer
P. 36
Acoustics of Regionally Accented Speech
the progress in this area has been relatively slow, hampered by time-consuming early-measurement techniques on one hand and by a general lack of theoretical or practical inter- est in studying language variation by speech scientists on the other.
A brief look at four important studies, all published in The Journal of the Acoustical Society of America, can help us appreciate how the attitude toward regional variation has gradually changed over the years. The first seminal acoustic study of vowel production by Peterson and Barney (1952) did not even consider that the variable regional background of the speakers could obscure the overall pattern of AE. A modern replication of the study by Hillenbrand et al. (1995) acknowledged and addressed this limitation by controlling for the dialect so that the majority of the speakers were se- lected from southern Michigan. Numerous differences be- tween the two studies were found that may stem from the fact that the participants in Hillenbrand et al. (1995) spoke the regional variant of the Inland North affected by the NCS.
As research interest in socially motivated indexical variation in pronunciation intensified in the early 2000s (which was to some extent driven by advances in speech technology ap- plications), acoustic explorations of regional vowel systems received a more serious consideration. To that end, Clopper et al. (2005) provided a comprehensive description of the acoustic differences among vowels in the six major dialect regions (see Figure 1). Further progress was stimulated by the discovery that regional accents utilize important acous- tic details in the dynamic vowel structure that contribute to audible differences among dialects (Fox and Jacewicz, 2009).
Exploration of Acoustic Details in Regional Vowel Systems
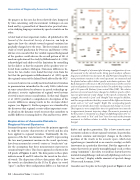
Formant frequency analysis has been the primary approach to study the acoustic characteristics of vowels and has also been applied to regional variation. Traditionally, the fre- quencies of the first two formants, F1 and F2 (representing the two most prominent maxima in the vowel spectrum), have been measured at a vowel’s center or “steady state” un- der the assumption that these measurements represent its canonical target values. This classic approach is shown in the left panels of Figures 2 and 3. The data points in these plots indicate mean F1 and F2 values for the vowels in the select- ed words. The dispersion of these data points tells us how the vowels are distributed in the F1 by F2 plane (or vowel “space”) and how their configuration differs as a function of
Figure 2. Example of a formant plot showing a configuration of vow- els measured in the selected words. Using speech analysis software, frequencies of the first two formants, F1 and F2 (representing the two most prominent maxima in the vowel spectrum) are measured and the plotted values reflect dialect-specific articulation patterns. Left: Each data point is the mean ± SE of several instances of the vowel in each word spoken by seven women in their 70s and 80s (top ) and ten girls 8-10 years old (bottom) from central Ohio (OH). The relative positions of several vowels have changed in children’s speech, reflect- ing cross-generational sound change in this speech community. For example, the vowels in “pots” and “thought” have merged in children, and this merger indicates that they cannot tell the difference between words such as “cot” and “caught.” Right: The corresponding panels provide more details about time-varying spectral change in a vowel. The frequencies were sampled five times in equidistant time intervals to approximate formant trajectory shape. The acoustic proximity of the five points is interpreted as a degree of diphthongization. For ex- ample, the vowels in “bits” and “bats” have lost much of the formant movement in children relative to adults, becoming more monoph- thongal.
dialect and speaker generation. This is how acoustic mea- surements inform us about regional variation. In particular, researchers examine and interpret changes in the relative positions of the vowels in the acoustic space, which may signal mergers (manifested as an acoustic overlap) or shifts (movement in a particular direction). But this approach as- sumes that vowels are purely monophthongal (such as when saying “iiiiiiiiiiiiiii”). In reality, research has shown that even nominal monophthongs (and not only diphthongs such as in “my-cow-boy”) display reliable amounts of spectral change (Nearey and Assmann, 1986).
Consider now the plots in the right panels of Figures 2 and
34 | Acoustics Today | Summer 2016
