
Page 37 - 2016Summer
P. 37
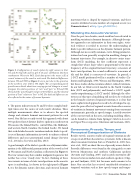
 Figure 3. Configuration of vowels spoken by eight women in their 70s and 80s (top left) and ten girls 8-10 years old (bottom left) from southeastern Wisconsin (WI). Each data point is the mean ± SE of several instances of the vowel in each word. The dialectal differences between WI and OH (see Figure 2) are in part due to the operation of the northern cities shift in WI. Right: The corresponding panels provide more details about time-varying spectral change in a vowel. Compare the relative positions of "cuts" and "pots" in WI and OH, the lack of the "pots/thought" merger in WI children, and the elevated position of "bats" relative to "bets" in WI. The dialectal differences are also reflected in the nature of formant dynamics.
3. The points indicate mean F1 and F2 values sampled mul- tiple times over the course of each vowel’s duration. These multiple measurements allow us to observe the spectral change and estimate formant movement patterns for each vowel. Our lab has recently tested this approach with about 360 speakers from 3 distinct dialects spoken in southeastern Wisconsin (the Inland North), central Ohio (the Midland), and western North Carolina (the Inland South). We found that such detailed acoustic variations indicate dialect-specif- ic use of dynamic information in vowels to enhance cultural differences and cross-generational sound change (Jacewicz et al., 2011a,b,c; Jacewicz and Fox, 2013).
A good example of the dialect-specific use of dynamic infor- mation is the differential pronunciation of the vowel in bad in Wisconsin and North Carolina as illustrated in Figure 4. The two variants may have similar midpoint frequencies but neither has a true “steady state.” In fact, thinking of these two variants in terms of static vowel positions in the acoustic space is misleading. As shown in the right panel of Figure 4, it is the dynamic nature, direction, and extent of formant
movement that is shaped by regional variation, and these acoustic attributes become markers of a regional accent (see Demonstration 2, at http://goo.gl/bOFDWw ).
Modeling the Acoustic Variation
Over the past two decades, much work has been devoted to modeling variation in formant dynamics. Although descrip- tive approaches are informative in their own rights, statis- tical evidence is needed to increase the understanding of dialect-specific influences on the dynamic formant pattern. Although not necessarily common, curve-fitting parameter- ization has been generally accepted in modeling changes in formant trajectories. For example, in discrete cosine trans- form (DCT) modeling, the first coefficient represents a straight line whose slope value is proportional to the mean frequency of the original formant trajectory, a measure of basic vowel position; the second coefficient is a measure of tilt, and the third is a measure of curvature. In general, a 2-DCT model performed well in a number of studies (Za- horian and Jagharghi, 1993; Watson and Harrington, 1999), but these studies did not examine dialect-related variations. In our lab, we fitted several models to the North Carolina data (DCT and polynomials) and found a 3-DCT signifi- cantly outperforming a 2-DCT model. Although the effec- tiveness of this type of modeling still needs to be evaluated in the broader context of regional variation, it is clear that more sophisticated approaches need to be developed to sep- arate the pure effects of regional accents from other sources of variation in formant movement coming from consonant environments, prosody, or speech tempo. A useful overview of the current work in this area, including modeling efforts, can be found in a volume from Springer’s Modern Acoustics and Signal Processing series (Morrison and Assmann, 2013).
Consonants, Prosody, Tempo, and Perceptual Categorization of Dialects Besides vowels, acoustic studies of regional variation in oth- er aspects of AE have been far less systematic. Little is known about consonant variation (but see Purnell et al., 2005; Jace- wicz et al., 2009) or about the use of prosody across dialects. Prosodic differences were found in the rising pitch accents between Minnesotan and southern Californian speakers (Arvaniti and Garding, 2007) and in pitch movement dif- ferences between midwestern and southern speakers (Clop- per and Smiljanic, 2011) but far more work remains to be done. One area that has received considerable attention is temporal variation such as how speech tempo and tempo-
 Summer 2016 | Acoustics Today | 35
