
Page 32 - 2017Spring
P. 32
Speech Intelligibility Predictors
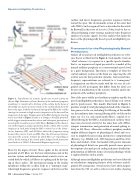
Figure 3. Transduction of acoustic signals into neural activity by the ear. Top: illustration of how vibration of the eardrum (tympanic membrane) is transferred to the base of the cochlea by the bones of the middle ear. A pressure wave travels in the cochlear fluids from the base to the apex, with the mechanical tuning of the BM in the cochlea causing it to resonate to high acoustic frequencies at the base and low frequencies at the apex. Displacement of the IHC cilia by the shearing forces described in Figure 2 leads to a change in the IHC potential, which triggers neurotransmitter release and subsequent generation of neural spikes in auditory nerve (AN) fibers. Bottom: further illustra- tion of the frequency analysis performed by the cochlea. The resonant frequency at each point along the BM is referred to as the charac- teristic frequency (CF), and AN fibers inherit this frequency tuning because they connect to just one IHC. Thus, the AN conveys informa- tion about the acoustic stimulus by which fibers are responding as well as by the timing of the neural spikes. Adapted with permission from Sachs et al. (2002) © Biomedical Engineering Society.
fibers by the organ of Corti. These spikes in the electrical potential of AN fibers are the basic information unit of the nervous system, and information about acoustic cues is en- coded both by which AN fibers are spiking and by the tim- ing of those spikes. The mechanical tuning of the basilar membrane within the cochlea leads to a “tonotopic map,” where high frequencies generate responses in the base of the
30 | Acoustics Today | Spring 2017
cochlea and lower frequencies generate responses further toward the apex. The electromotile action of the outer hair cells (OHCs) in the organ of Corti, as described in the article by Brownell in this issue of Acoustics Today, leads to the co- chlea performing a time-varying, nonlinear time-frequency analysis of acoustic signals. It is this analysis that forms the basis of the physiologically based speech intelligibility pre- dictors.
Framework for the Physiologically Based Predictions
Almost all neural speech intelligibility predictors are refer- ence based, as illustrated in Figure 4. Such models create an “ideal” reference (r) response to a specific speech stimulus, that is, an unprocessed signal presented to a model of the normal auditory periphery at a conversational speech level in a quiet background. This forms a template of what the central auditory systems of the brain are expecting the AN activity to be for that particular stimulus. Such neural time- frequency representations are referred to a “neurograms.” A comparison can then be made with the test case of a de- graded (d) AN neurogram that differs from the ideal case because of modification of the acoustic stimulus and/or im- pairment of the auditory periphery.
One of the most widely used auditory-periphery models for speech intelligibility prediction is that of Zilany et al. (2014) and its predecessors. This model, illustrated in Figure 5, provides a high level of physiological detail of the transduc- tion process in the ear, including the filtering of the middle ear, the nonlinear time-varying filtering of the cochlea in the inner ear (C1, C2, and control path filters), control of co- chlear filtering by the OHCs, transduction of cochlear vibra- tions into electrical activity by the inner hair cells (IHCs), synaptic transmission, and generation of neural spiking ac- tivity in AN fibers. Alternative auditory-periphery models employ different degrees of physiological detail and accu- racy to simplify the processing and increase computational efficiency (e.g., Elhilali et al., 2003; Jørgensen and Dau, 2011; Kates and Arehart, 2014), but models with greater amounts of physiological detail can generally provide more precise descriptions of neural speech coding and more detailed im- plementation of different forms of neural pathology, which is explored further in this article.
Although many intelligibility predictions are based directly on calculations comparing features of the reference and de- graded AN neurograms, several metrics have taken inspira- tion from the STI (as well as other recent studies showing
