
Page 35 - 2017Spring
P. 35
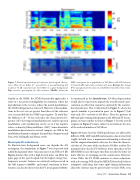
 Figure 7. Neural representation of a reference speech signal, the sen- tence “How do we define it?”, presented to a normal-hearing AN model at 65 dB sound pressure level (SPL) in a quiet background. Top: acoustic spectrogram for this sentence. Middle: mean-rate
Similar to the NSIM, the STMI theoretically approaches a value of 1 for perfect intelligibility. In situations where the degradations in the test case reduce the neural modulations, the STMI will approach a value of 0. However, if the modula- tions in the test case are greater than those of the reference case, it is possible for the STMI to go negative. To avoid this, the difference (R − D) for each time, the characteristic fre- quency (CF), the temporal modulation rate, and the spectral modulation scale combination can be set to 0 for negative values, as done by Zilany and Bruce (2007). Some alternative modulation-based metrics instead compute an SNR in the modulation domain to mitigate this problem (Jørgensen and Dau, 2011; Rallapalli and Heinz, 2016).
Example Predictions
To illustrate how background noise can degrade the AN neurogram, the simulations in Figure 7 were repeated with added background white Gaussian noise at an SNR of 0 dB. Figure 8 shows that such a high level of noise can fill in the quiet gaps of the speech signal, but the higher energy, low- frequency acoustic features are relatively well preserved in the MR response (middle), and neural synchrony to these features can also be observed in the FT neurogram (bottom).
(MR) neurogram for a population of AN fibers with CFs between 0.25 and 8 kHz and a time resolution of 6.4 ms. Bottom: fine-timing (FT) neurogram for the same set of AN fibers but with a time resolu- tion of 0.16 ms.
As mentioned in the Introduction, AN fiber degeneration would also be expected to degrade the overall neural repre- sentation, an effect that cannot be captured by the acoustic- based predictors. This is illustrated in Figure 9, where the speech stimulus is presented in quiet (as in Figure 7) but with only 30% survival of AN fibers. Here the patterns of MR and spike-timing information in the MR and FT neuro- grams are more similar to those in Figure 7, but the overall response in Figure 9 is more subject to neural noise because of the reduced number of AN fibers.
Figure 10 shows how the NSIM predictions are affected by different SNRs (left) and different amounts of neural survival (right). In both cases, a monotonic relationship is observed, and the empirical maximal values are less than the theoreti- cal value of 1 because of the stochastic AN fiber activity. The maximal values for the FT NSIM are lower than those of the MR NSIM because the larger time bins used for the latter are more effective at averaging out the neural noise. However, at low SNRs, the FT NSIM continues to show reductions, with a decreasing SNR when the MR NSIM reached its lower asymptote, indicating that some spike-timing information about the sentence may be preserved at very low SNRs, even
 Spring 2017 | Acoustics Today | 33
