
Page 46 - 2017Winter
P. 46
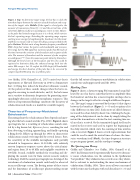
Target-Ranging Theories
 Figure 1. Top: To determine target range, the bat has to clock the time that elapses between the emission of each broadcast and recep- tion of the target’s echo. Middle: If the signal is a brief pulse, the moment of transmission (time [t] = 0) and the arrival time of the echo (time difference [dt]) are unambiguous events in time. Howev- er, the pulse has limited energy because it is so brief, which restricts the bat’s operating range. Extending the operating range requires emitting more energy by lengthening the broadcast, but the band- width has to remain wide to retain the delay acuity provided by the pulse. Bottom: The bat emits a long-duration frequency-modulated (FM) chirp that retains the pulse’s wide bandwidth and increases the energy, but the FM signal has numerous peaks that fill much of the time between the emission of the broadcast and reception of the echo. The moment of broadcast and the moment of echo reception are ambiguous (“?”) from the numerous peaks taken by themselves. Although the brief onsets of the broadcast and the echo could be registered to determine delay, the enhanced energy built into the entire FM sweep is lost. To exploit the FM chirp’s full bandwidth and energy, the short duration of the pulse has to be recovered by compressing the FM sweep into a synthetic pulse.
(see Griffin, 1958: Grinnell et al., 2017) carried out classic experiments at Harvard University in 1940 to demonstrate that (1) flying bats indeed do broadcast ultrasonic sounds, (2) the pattern of these sounds changes when the bat is en- gaged in swerving to avoid obstacles, and (3) the bat’s inner ear is sensitive to ultrasonic frequencies by generating corre- spondingly ultrasonic cochlear microphonic responses. This trifecta of experimental findings constitutes the discovery of echolocation and stands as a model for scientific inquiry.
Theories of Frequency-Modulated Echolocation
Theorizing about the echolocation of bats depends on know- ing what the bat’s sounds are like (Pye, 1980). Figure 2 shows spectrograms for a recording of echolocation sounds emit- ted by a big brown bat, Eptesicus fuscus, searching for and then detecting, tracking, approaching, and finally capturing a flying beetle. Efforts up through the 1950s to characterize echolocation sounds were impeded by several factors. First, the sensitivity of the available microphones only partially extended to frequencies above 15-20 kHz, with relatively uneven frequency-response curves above the critical mini- mal region from 20 to 40 kHz and negligible sensitivity to 100 kHz. Second, available methods for recording and dis- playing the sounds were far from current acoustic analysis technology. Until the sound spectrograph was developed, the waveforms of echolocation sounds could only be observed on an oscilloscope screen. The fleeting nature of these traces and the limitations of oscilloscope photorecording meant
44 | Acoustics Today | Winter 2017
that the full extent of frequency modulation in echolocation sounds was underappreciated until the 1960s.
Marking Time
Figure 3 shows a downsweeping FM transmitted sound fol- lowed by an echo that is somewhat lower in amplitude than the broadcast and also has a more irregular envelope due to changes in the target’s reflective strength at different frequen- cies. The target’s range is conveyed by the time (t) that elapses between the broadcast (Figure 3, t = 0) and reception of its echo (difference in time [dt]). Each meter of added distance increased the echo’s delay by about 6 ms. Marking the begin- ning of the delay interval can be done by simply taking the instant the transmitter is activated to start counting time un- til an echo is received. Or the transmitted signal itself can be routed to the receiver and used to register the beginning of the delay interval, which starts the counting of time until an echo is received. Figure 3 shows several representations that could be used to mark the arrival time of echoes: the time- series waveform itself (black), the time-frequency structure or spectrogram (green), and the envelope (orange).
The Spectrogram Theory
Griffin and Galambos (see Griffin, 1958; Grinnell et al., 2017) had demonstrated experimentally that active ultrason- ic sonar, echolocation, was the solution to the Spallanzani “bat problem.” They elaborated on several issues they identi- fied as relevant to understanding the inner mechanisms of echolocation (Griffin, 1958). These issues all were concerned with the time axis that begins with each broadcast (t = 0) and
