
Page 23 - Spring 2018
P. 23
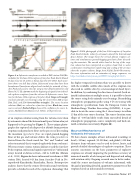
                                 Figure 4. a: Infrasonic waveforms recorded at IMS station IS44 (Ka- mchatka) for the June 2009 eruption of Sarychev Peak, Kurile Islands (5 days: June 11-16, 2009, or Julian days 162-167 2009). Each wave- form shows one full day of data. Infrasound array data have been beamformed (waveforms aligned and stacked for azimuth of Sary- chev Peak and acoustic velocity) using a time-delay beamformer and filtered 0.5-5 Hz. Arrows mark the beginning of signals from individ- ual explosive eruptions from the volcano. b: Infrasonic source loca- tion for the June 2009 eruption of Sarychev Peak (large red triangle) via back-azimuth cross bearings using the closest three IMS arrays: IS44, IS45, and IS30 (inverted blue triangles). The source location solutions (dots) are colored as a function of time. Black star, mean source centroid. Dashed ellipse shows 90% confidence for source lo- cation. Modified from Matoza et al. (2011), with permission.
of an eruption column issuing from the volcano were taken by astronauts aboard the International Space Station who just happened to be passing by (Figure 5). These unique photo- graphs also captured ash dispersed at altitude from previous eruptions and pyroclastic flows in the process of descending the mountain (pyroclastic flows are rapid ground-hugging flows of hot gas and volcanic debris; the term pyroclastic is derived from the Greek words for “fire” and “broken” and refers to material that is erupted explosively from a volcano). Whereas remote seismic stations did not record the Sarychev Peak eruption, infrasound signals registered at 7 infrasound arrays located at distances from ~640 to 6,400 km (Matoza et al., 2011). Figure 4a shows infrasound waveforms at IMS station IS44, located 643 km from Sarychev Peak in Pet- ropavlovsk-Kamchatsky, Kamchatka, Russia. Retrospective analysis shows that the remote IS44 infrasound waveforms provide a detailed record of the explosion chronology that
Figure 5. NASA photograph of the June 2009 eruption of Sarychev Peak, Kurile Islands, taken by astronauts aboard the International Space Station. The image shows the vertical plinian eruption col- umn and simultaneous ground-hugging pyroclastic flows descend- ing the mountain. The smooth white cloud at the top of the erup- tion column has been interpreted as a pileus cloud, that is, water condensation resulting from rapid rising and cooling of the air mass above the eruption column. Image from NASA’s Earth Observatory. For more information and an animation of image sequences, see https://earthobservatory.nasa.gov/IOTD/view.php?id=38985.
has higher temporal resolution than was possible to derive with the available satellite data (much of the eruption was obscured in satellite data by a meteorological cloud layer). In addition, by combining the direction-of-arrival (back-az- imuth) information at multiple arrays, it is possible to locate the source using back-azimuth cross bearings. By modeling atmospheric propagation paths using 3-D ray tracing with atmospheric specifications from the European Centre for Medium-Range Weather Forecasting (ECMWF), it is pos- sible to locate the source using the 3 closest arrays to within 15 km of the true source location. The source-location error ellipse of ~100 km likely results from unresolved details of atmospheric propagation, source complexity, and back-azi- muth estimation uncertainty (Figure 4b).
Source Mechanisms of
Volcanic Infrasound
We have shown examples of how infrasound recordings at local (<15 km), regional (15-250 km), and global (>250 km) distances from volcanoes can be used to detect, locate, and provide detailed chronologies of explosive eruptions. These acoustic constraints on the basic parameters of explosive eruptions are already improving the prediction accuracy of numerical models of ash transport and dispersal and aiding with aviation safety. Ongoing research aims to better under- stand the source mechanism of volcanic infrasound, with the goal of providing detailed, quantitative parameters of the eruption based on infrasound observations.
  Spring 2018 | Acoustics Today | 21
