
Page 24 - Spring 2018
P. 24
Volcanic Eruption Infrasound
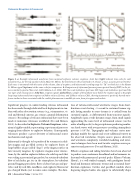
Figure 6. a: Example infrasound waveforms from sustained explosive volcanic eruptions. Scale bars (right) indicate time scale for each waveform (e.g., for the top waveform from Mount St. Helens, the time between the arrowheads is 0.1 hour). y-Axis, acoustic pressure (in Pa). Each trace is annotated with the name of the volcano, date of eruption, and infrasound recording range (r). “M” on third axis is the Mount St. Helens signal (top trace) at the same scale for comparison. b: Comparison of infrasound pressure power spectral density (PSD) to the jet- noise similarity spectra (Tam et al., 1996; Matoza et al., 2009). FST, fine-scale turbulence spectrum; LST, large-scale turbulence spectrum (the two types of jet mixing noise). Solid lines, eruption signals; dashed lines, samples of the ambient noise before the eruption signal. c: Example long-range infrasound from eruptions at Nabro volcano, Eritrea, and Calbuco volcano, Chile, showing asymmetric positively skewed wave- forms similar to those associated with the crackle phenomenon in audible jet noise from jet engines and rockets.
Significant progress in understanding volcano infrasound has been made through dedicated local deployments in tan- dem with other observation systems (e.g., seismometers, vi- sual and thermal cameras, gas sensors, ground deformation sensors). Recordings of volcanic infrasound have now been made at numerous volcanoes worldwide (Fee and Matoza, 2013). As described in Explosive Volcanic Eruptions, volca- nism is highly variable, representing a spectrum of processes ranging from effusive to explosive behavior. Consequently, volcanoes produce a great diversity of infrasound source mechanisms and signals.
Infrasound is thought to be produced by resonance in shal- low magma and gas-filled cavities; by explosive bursts of large bubbles of gas (called “slugs”) at the magma surface in low-viscosity magmas; by explosive magma-water interac- tions; by the sudden explosive failure of a solid cap rock that was sealing a pressurized gas pocket; by sustained turbulent flow of ash-laden gas jets in the atmosphere; by turbulent ground-hugging pyroclastic flows of dense hot gas and par- ticles; and by rock falls, mudflows, and explosive blowout of gas-charged blocks, just to name some examples. The dura-
22 | Acoustics Today | Spring 2018
tion of volcano-infrasound waveforms ranges from short- duration events lasting ~1 second to sustained tremor sig- nals lasting months to years (tremor is a catchall term for sustained signals, as differentiated from transient signals). Amplitudes span a wide dynamic range, from small signals approaching the noise level of infrasound sensors (on the order of millipascals) to larger explosions producing nonlin- ear shock waves with overpressures exceeding atmospheric pressure (>105 Pa). Topography and volcanic crater mor- phology modify the signals and create additional variety in the observed waveforms. Despite source process diversity and waveform complexity, wavefield modeling and inver- sion techniques have been used to infer eruption source pa- rameters and processes (Fee and Matoza, 2013).
Effusive eruptions and roiling lava lakes have been observed to produce near-continuous broadband and/or harmonic in- frasound with pronounced spectral peaks. Kilauea Volcano, Hawai’i, is a well-studied example, with prodigious broad- band and harmonic infrasonic tremor and occasional short- duration explosions. Cavities and gas-filled conduits above degassing magma bodies also appear to substantially shape
