
Page 29 - Spring 2018
P. 29
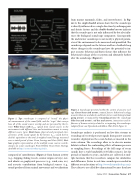
 Figure 1. Top: soundscape is composed of “sound,” the physi- cal measurements of the sound field, and the “scape” that conveys how all of the sound sources overlap and are perceived by the lis- tener White boxes with Si(1-7), signals from sound sources in the environment with different sizes and orientations meant to convey different source types; black boxes, physical and perceptual char- acteristics of the sound signals by the listener. LAeq, sound level in decibels equivalent to the total A-weighted sound energy measured over a stated period of time. From Jennings and Cain (2013). Bot- tom: graphic representation of the multiple ocean sources contrib- uting to an ocean soundscape. From NOAA’s Ocean Noise Strategy. Available at http://acousticstoday.org/nefsc.
composed of contributions (Figure 2) from human activity (e.g., shipping, fishing vessels, seismic airgun surveys), nat- ural abiotic or geophysical processes (e.g., wind, rain, ice), and acoustic contributions from biological sources (e.g., sound produced from animal movement and vocalizations
Figure 2. Soundscape presented within the context of acoustic ecol- ogy. Green boxes and arrows, natural factors: behavioral ecology, acoustic behavior, and abiotic and biotic factors contributing to (out- going arrows) or impacted by (incoming arrows) the soundscape (blue box and arrows); red box and arrows, interactions and in- fluences of human activity related to or impacting the soundscape. Adapted from van Opzeeland and Miksis-Olds (2012, Figure 1).
Soundscape analysis is performed on live-data streams or recordings of received pressure signals from passive acoustic recorders deployed on the ocean bottom or moored in the water column. The recordings allow us to observe marine habitats without the confounding effects of human presence or sampling biases. Recordings of the full range of ocean sounds have a wide bandwidth (150 kHz or more), last for periods of months to years, and often are collected at mul- tiple locations that the researchers compare for similarities and differences (listen to real-time soundscapes recorded in different ocean locations at http://www.listentothedeep.com). These datasets are called five-dimensional because they have
from marine mammals, fishes, and invertebrates). In Fig- ure 2, the single-headed arrows show that the soundscape is directly influenced in a single direction by anthropogenic and abiotic factors and the double-headed arrows indicate that the soundscape is not only influenced by but also influ- ences the biological soundscape component. Consequently, the underwater soundscape is not merely a physical param- eter of the environment to be measured and quantified. The soundscape depends on the listener and has a feedback loop where changes in the soundscape have the potential to im- pact acoustic behavior and biotic factors that influence the behavioral ecology of the ecosystem and ultimately further alter the soundscape (Figure 2).
    Spring 2018 | Acoustics Today | 27
