
Page 30 - Spring 2018
P. 30
Exploring the Ocean Through Soundscapes
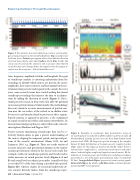
Figure 3. Five minutes of acoustic data from a seismic vessel and air- gun array passing over a directional hydrophone. Top: sound pressure level time series. Bottom: spectrogram where color indicates direction of arrival shown by the color wheel (yellow, North; blue, South). The sensor was 60 cm from the seabed in 110 m of water. Note that the vessel direction color changes before the impulses from the airgun ar- ray because the array was ~100 m behind the vessel.
time, frequency, amplitude, latitude, and longitude. The goal of soundscape analysis is extracting information from the recordings to identify which sources are present, the source amplitudes, how sources interact, and how animals in the en- vironment may perceive and respond to the sounds. In recent years, some research teams have started making directional soundscape recordings that increase the data to six dimen- sions by adding the direction of arrival (Figure 3). Direc- tional pressure sensors in deep water also offer the potential to measure particle motion. Unfortunately, this methodology does not extend to accurate measurements of particle mo- tion near the sea surface, at the seabed, or in shallow water because it is not linearly related to pressure in these regions. Particle motion, as opposed to pressure, is the component of sound sensed by most fishes and marine invertebrates. Its measurement and perception is a subject that needs extensive investigation (Hawkins and Popper, 2017).
Passive acoustic monitoring (soundscape) data can be se- lectively broken down to gain a greater understanding of the sources shaping the temporal, spatial, and spectral pat- terns of the acoustic environment (Mann, 2012; Au and Lammers, 2016; e.g., Figure 4). There are a wide variety of acoustic measures and presentation formats in the marine soundscape literature related to the foci of each study. For example, studies of soundscape patterns and trends tend to utilize measures of sound pressure levels (Figure 4, A and B) and sound level exceedance percentiles (sound level that is exceeded N% of the time during a specified time period; Figure 4D), whereas studies of ecosystem biodiversity de- rive acoustic diversity indices from the soundscape repre-
28 | Acoustics Today | Spring 2018
Figure 4. Examples of soundscape data presentations using an 11-month dataset recorded 20 m off the seabed in 1,280 m of water off Newfoundland, Canada. A: time series of 1-hour band-limited sound pressure levels (SPL). B: long-term spectral average of the complete dataset. C: daily distributions of 1-minute acoustic complexity index (ACI) values for the frequency band of 40-200 Hz. Values below 1 indicate lower complexity (i.e., continuous sound sources) and values above 1 indicate higher complexity (impulsive sound sources). D: dis- tribution of 1-minute power spectral densities including exceedance percentiles (i.e., 5% of the power spectral density values exceeded the L5 line). Orange dashed ellipses, presence of seismic survey signals; black solid ellipses, fin whales; solid blue circles, a distant dynamic positioning (DP) vessel signature.
