
Page 14 - Winter2018
P. 14
Age-Related Hearing Loss
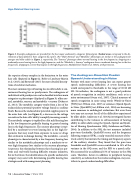
Figure 3. Example audiograms are provided for the four major audiometric categories (phenotypes). Shaded areas correspond to the dis- tribution of data labeled in these categories by experts. The “Older-Normal” and “Metabolic” phenotypes are similar to the audiograms for younger and older adults in Figure 1, respectively. The “Sensory” phenotype shows normal hearing in the low frequencies, dropping to a moderately severe hearing loss in the high frequencies, and the “Metabolic + Sensory” audiogram shows a moderate hearing loss in the low frequencies, dropping to a severe hearing loss in the high frequencies. Modified from Vaden et al. (2017), with permission.
the superior olivary complex in the brainstem to the outer hair cells (depicted in Figure 2). Refer to Lonsbury-Martin et al. (2017) and Brownell (2017) for more detailed descrip- tions of cochlear mechanics.
The most common type of hearing loss in older adults is sen- sorineural hearing loss or presbyacusis. The audiograms of individuals with presbyacusis can be classified into four main categories or phenotypes (displayed in Figure 3): older nor- mal, metabolic, sensory, and metabolic + sensory (Dubno et al., 2013). The metabolic category results from a loss of the endocochlear potential (positive voltage found in cochlear fluid). Because the endocochlear potential supplies power to the outer hair cells (see Figure 2), a decrease in the voltage can reduce the hair cells’ ability to amplify incoming sounds. The metabolic category is typified by a flat mild hearing loss in the low frequencies gradually sloping to greater hearing loss in the high frequencies. The sensory phenotype is typi- fied by a moderate-to-severe hearing loss in the high fre- quencies that may result from exposure to noise or drugs that are known to damage hearing. The metabolic + sensory phenotype is characterized by a low-frequency hearing loss similar to the metabolic phenotype and a moderate-to-se- vere high-frequency loss similar to the sensory phenotype. At present, the relationship between these hearing loss pat- terns and real-world hearing difficulty remains unknown, but in the future, the identification of a specific audiometric category may assist with determining possible hearing loss etiologies and with management planning.
The Audiogram Does Not Predict Speech Understanding in Noise
Patients with more severe hearing loss can expect greater speech understanding difficulties. A severe hearing loss would correspond to thresholds in the range of 60-90 dB HL. Nevertheless, the audiogram is not a good predictor of speech recognition in realistic conditions, such as in a noisy environment (Souza et al., 2007). Clinical measures of speech recognition in noise using words (Words-in-Noise [WIN] test; Wilson et al., 2007) or sentences (Quick Speech in Noise [QuickSIN] test; Killion et al., 2004) are becoming more common in audiological evaluations. But even these tests may not account for all of the difficulties experienced by older adults. Anderson et al. (2013a) investigated factors contributing to the variance in self-assessment of hearing ability in older adults using the Speech, Spatial, and Quali- ties of Hearing Questionnaire (SSQ; Gatehouse and Noble, 2004). In addition to the SSQ, the test measures included pure-tone thresholds, QuickSIN scores, and the frequency following response (FFR), a scalp-recorded measure of elec- trical activity that mirrors the timing and frequency aspects of the auditory stimulus. They found that the pure-tone thresholds and QuickSIN scores contributed to 15% of the variance in the SSQ score, and the FFR to a speech sylla- ble accounted for an additional 15% of variance in the SSQ score. Therefore, factors in addition to peripheral hearing sensitivity, as indicated on the routine audiogram, may con- tribute to speech understanding difficulties.
12 | Acoustics Today | Winter 2018
