
Page 13 - Winter2018
P. 13
with normal hearing and a typical older adult with hearing loss. The y-axis plots the levels (in dB hearing level [HL]) at which the listener can just barely hear the sound. In this case, the reference for decibels is the average thresholds for a large group of normal-hearing individuals who have no ear diseases, so smaller values (near 0 dB HL) indicate normal hearing and larger values indicate hearing loss. Note that the y-axis is reversed from the typical plotting convention so that the audiogram plots better thresholds nearer the top and poorer thresholds nearer the bottom.
Figure 1. Pure-tone thresholds as a function of frequency (“audio- gram”) for a typical younger adult with normal hearing (solid lines) and typical older adult with hearing loss (dotted lines). When thresholds are plotted on an audiogram, lower thresholds (near 0 dB hearing level [HL]) are near the top, indicating better hearing, and higher thresholds are near the bottom, indicating hearing loss (see text). According to the audiogram, the older adult has a mild hear- ing loss in the low frequencies, sloping to a moderately severe hearing loss in the high frequencies, which represents a typical pattern of age- related hearing loss.
From the audiogram and one or more measures of speech recognition, the audiologist interprets the results to assess the type of hearing loss and the integrity of each part of the peripheral auditory system. The ear is composed of three main parts that contribute to audition: the outer ear (pinna and ear canal), the middle ear (eardrum, air-filled middle ear cavity, and middle ear bones), and the inner ear (cochlea and auditory nerve).
One issue might be a conductive hearing loss that usually indicates a pathology in the outer or middle ear, such as
middle ear fluid or fusing of the middle ear bones, which prevents their movement in response to sound. These are ex- amples of pathologies that prevent the conduction of sound through the middle ear. In contrast, a sensorineural hearing loss suggests a pathological condition in either the cochlea or the auditory nerve. The “sensory” component refers to the cochlea, and the “neural” component refers to problems pri- marily in the auditory nerve.
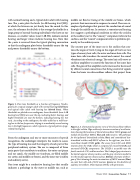
The sensory part of the inner ear is the cochlea that con- tains the organ of Corti. Lying on the organ of Corti are two types of sensory hair cells, the outer and inner hair cells. The inner hair cells transduce the sound and convert the sound vibrations into electrical energy. The outer hair cells serve as cochlear amplifiers to control the function of the inner hair cells. The gain of this amplifier can be increased or decreased by efferent neural connections that bring control of signals from the brain via olivocochlear reflexes that project from
Figure 2. A schematized anatomic view of the olivocochlear reflexes to the right cochlea. Top: outline of a transverse section of a cat brain- stem showing the locations of lateral olivocochlear (LOC; green) and medial olivocochlear (MOC; blue and red) neurons. The pathways for the ipsilateral (stimulated cochlea; blue) and contralateral (un- stimulated cochlea; red) MOC reflexes to the right ear join the ol- ivocochlear bundle (OCB; gold). The axons from LOC and MOC neurons form the OCB, which is composed of crossed (COCB) and uncrossed (UOCB) components. The COCB is accessible near the fourth ventricle. CN, cochlear nucleus. The S-shaped gray structure is the lateral superior olivary nucleus, and the gray structure medial to it is the medial superior olivary nucleus. Bottom: schematic of the or- gan of Corti showing the main terminations of MOC neurons (blue) on outer hair cells and of LOC neurons (green) on the dendrites of auditory nerve fibers. From Guinan (2006), with permission.
Winter 2018 | Acoustics Today | 11
