
Page 12 - Fall2019
P. 12
Hospital Soundscapes
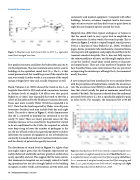
Figure 1. Hospital noise levels from 1960s to 2017. Leq, equivalent sound level averaged over time.
best predicts reactions and allows for before/after and site A/ site B comparisons. The most common noise metric used in buildings is the equivalent sound level (Leq). The Leq is that sound pressure level that would be present if the sound in the area were steady. In other words, it is a measure of the sound energy averaged over time and, usually, frequency as well.
Busch-Vishniac et al. (2005) showed the trends in the Leq in hospitals from 1960 to 2005 and noted a monotonic increase in daytime levels of roughly 0.38 dB/yr over that period. Ryherd et al. (2011) later expanded that work to 2010 for a subset of data collected by the Healthcare Acoustics Research Team, and, more recently, Weber (2018) has expanded it to 2017. Note that the levels reported by Weber were all prein- tervention (baseline) and may include both day and night levels. The result is shown in Figure 1, which demonstrates that the Leq reported in hospitals has continued to rise for nearly 70 years! There are many potential causes for this relentless increase in the sound levels: hospitals first started to be air-conditioned in the 1960s; the required air refresh rates keep rising to lower the number of pathogens in the air; the use of hard surfaces has gained popularity to reduce infections; the amount of equipment in use at bedsides has constantly increased and each new machine introduces noise; and the density of patients has greatly increased.
The distribution of sound levels in Figure 1 is tighter than one might expect given that the hospitals represented are widely disbursed worldwide and vary greatly in architecture, acuity, speciality, and size. This suggests that the noise sources that dominate in hospitals are not simply related to build- ing operations but are also strongly linked to the building occupants, in other words, conversations, activity noise, and
commonly used medical equipment. Compared with office buildings, factories, or homes, hospitals tend to have more types of noise sources and they don’t seem to quiet down at night because hospitals operate around the clock.
Hospitals also differ from typical workspaces or homes in that the sound tends to vary a great deal in amplitude on short timescales. In other words, the sound is peaky. This is shown in Figure 2, which is a typical hospital sound pressure level as a function of time (Ryherd et al., 2008). Overhead pages, alarms, pneumatic tube mechanisms, motorized doors, moving carts and equipment, and people all contribute to the transient sounds in hospitals. The Leq does not fully capture the relative peakiness of noise, and this might explain why it is not the “perfect” stand-alone sound metric to character- ize hospital noise. There are a fair number of hospitals that have benefited from noise interventions that are perceived as improving the soundscape, although the Leq has remained nearly the same.
A new measure has been introduced to try to correlate better with the perceptions of hospital noise, namely, the occurrence rate. The occurrence rate [OR(N)] is defined as the fraction of time that a level (usually the peak or maximum sound level) exceedsNdecibels.Themeasureisderivedfromthetraditional percentile level metric (Ln) but is specifically applied to peak or other levels. For example, the maximum OR at 90 dB
Figure 2. Sound pressure level versus time for a typical hospital room. L Aeq, equivalent A-weighted sound pressure level (dark blue line); L AFmin, A-weighted minimum sound pressure level (fast averaging; dotted line); L AFmax, maximum A-weighted sound pressure level (fast averaging; red line), L CFpeak, peak sound pressure level with a C-weighting scale (light blue line). Reproduced from Ryherd et al., 2008.
12 | Acoustics Today | Fall 2019
