
Page 58 - Fall2019
P. 58
Nonlinear Acoustics Today
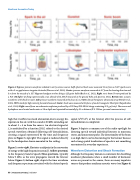
Figure 4. Top row: pressure waveforms radiated in air by various sources. Left: spherical shock wave measured 19 cm from a 15-kV spark source with a 2-cm gap between tungsten electrodes (Karzova et al., 2015). Center: pressure waveform measured at 60° from the shooting direction and 3 m from the muzzle of a .357 Magnum handgun revolver firing a 125-grain bullet (Beck et al., 2011). Right: sonic boom N wave produced by a F/A-18B fighter jet flying supersonically at an altitude of 31,550 ft measured at the ground (Cho and Sparrow, 2011). Bottom row: acoustic waveforms with shocks in water. Left: pressure waveform measured at the focus of a 1.2-MHz clinical therapeutic ultrasound array (Kreider et al., 2013). HIFU stands for high-intensity focused ultrasound. Center: shock wave measured at the focus of an electromagnetic lithotripter (Sapozhnikov et al., 2014). Right: sound from an underwater explosion produced by a US Navy SUS Mk 64 charge containing 31.2 g of tetryl. The source and hydrophone were located underwater at 18 m depth and separated horizontally by 21 m distance (P. S. Wilson, personal communication).
high that it suffers too much attenuation due to energy dis- sipation in the air, with the sound at 60 kHz extending out to about L = 5 m from the source. An electrical signal at f0 is modulated by a function [E(t)] related to the desired speech waveform obtained following self-demodulation, creating a signal represented by the time and frequency plots in Figure 3, top right. This signal is radiated directly by the loudspeaker shown mounted in the ceiling.
Figure 3, center right, illustrates a midpoint in the conversion of energy at the high frequencies around f0 (yellow spectrum) to the frequency band of speech (blue spectrum), typically below 5 kHz, as the wave propagates toward the listener below. Figure 3, bottom right, depicts the time waveform and frequency spectrum associated with the desired speech
signal (d2E2/dt2) at the listener after the process of self- demodulation is completed.
Figure 3 depicts a common use of the audio spotlight for directing speech toward individual listeners in museums, stores, and amusement parks. The directionality of the beam is so high that it can be disorienting for the listener because such strong spatial localization of speech is not something encountered in everyday experience.
Waveform Distortion and Shock Formation
Although the frequency domain is convenient for describing nonlinear phenomena when a small number of harmonic waves are present in the source, there are many impulsive sources that produce nonlinear acoustic waves (see Figure 4)
58 | Acoustics Today | Fall 2019
