
Page 24 - Spring2019
P. 24
Theracoustic Cavitation
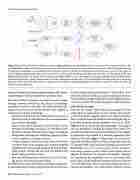
Figure 2.Time domain illustration of passive acoustic mapping (PAM) processing. Bubble emissions are received on an array of sensors. Sig- nals (black) have relative delays that are characteristic of the distance between the array and the source location. After filtering the raw data to isolate either broadband or narrowband acoustic emissions of interest, the first processing step is to steer the array to a point in the region of interest (ROI) by applying time shifts to each array element. If the steered location matches that of the source (x = xs), the signals will be time aligned (red); otherwise, the signals will be temporally misaligned (blue; x ≠ xs). The second processing step combines the time-shifted signals to estimate signal power; poorly correlated data will lead to a low power estimate while well-correlated data will identify the source. Repeating this process over a grid in the ROI leads to an image of source (bubble) strength (bottom left). The image has a dynamic range of 100, and red indicates a maximum value.
domain, but frequency domain implementations offer equiva- lent performance with potentially lower calculation times.
The roots of PAM techniques are found in passive beam- forming research performed in the context of seismology, underwater acoustics, and radar. The utility of these tech- niques comes from their specific benefits when applied to noninvasive cavitation monitoring.
• Images are formed in the near field of the receive array so that sources may be identified in at least two dimensions (e.g., distance and angle).
• Received data may be filtered to identify bubble-specific emissions (half-integer harmonics or broadband noise elevation), thereby decluttering the image of nonlinear background scattering and identifying imaging regions that have different cavitation behaviors.
• A single diagnostic ultrasound array system can be used to provide both tissue imaging and cavitation mapping capabilities that are naturally coaligned so that the moni- toring process can describe the tissue and bubble status before, during, and after therapy.
• Real-time PAM may allow automated control of the ther- apy process to ensure procedural safety.
For both passive and active ultrasonic methods, image qual- ity and quantitative accuracy may be limited by uncertainties
in tissue sound speed and attenuation. Unlike MR or active ultrasonic methods, PAM data must be superimposed on tis- sue morphology images produced by other imaging methods to provide a context for treatment guidance and monitoring.
Clinical PAM Example
Over the last decade, PAM research has progressed from small-rodent to large-primate in vivo models, and recently, a clinical cavitation mapping dataset was collected during a Phase 1 trial of ultrasound-mediated liver heating for drug re- lease from thermally sensitive liposomes (Lyon et al., 2018). Figure 3 shows an axial computed tomography (CT) image of one trial participant, including the targeted liver tumor. The incident therapeutic-focused ultrasound beam (FUS; Figure 3, red arrow) was provided by a clinically approved system, while the PAM data (Figure 3, blue arrow) was collected us- ing a commercially available curvilinear diagnostic array. The CT-overlaid PAM image (and movie showing six consecutive PAM frames, see acousticstoday.org/gray-media) was gener- ated using a patient-specific sound speed estimate and an adaptive beamformer to minimize beamwidth. Although the monitoring was performed over an hour-long treat- ment, only a small handful of cavitation events was detected (<0.1% of exposures). This was as expected given that no ex- ogenous microbubbles were used and the treatment settings
22 | Acoustics Today | Spring 2019
