
Page 50 - Spring2019
P. 50
Heptuna and Biosonar
avoided that tail rest pole. He moved his tail up, down, right,
AB
and left, always trying to not have that “thing” touch his tail. By systematic and precise reinforcement of small tail movements, however, Heptuna finally touched the device with his tail.
With Heptuna finally positioned correctly, it was possible to start the detection training. Whereas the stationing training took weeks, Heptuna was 100% in detection performance in just one 100-trial session! To capture outgoing clicks, Mari- on Ceruti, a colleague, and Whit developed a computerized system that could analyze the echolocation click train that Heptuna emitted, computing both the overall peak level and peak frequency of the emitted clicks while doing a real target detection task (Ceruti and Au, 1983).
During a trial, a computer monitored Heptuna’s outgoing clicks and would alert the experimenter if Heptuna met the criterion of either high or low source level or high or low peak frequency and whether the signal was correct. When the computer sounded a high-frequency pure tone, Heptuna would emit loud clicks above the criterion, and when the computer sounded a lower frequency tone, he would keep his clicks below the level criterion. The experimenters also established a frequency criterion, and when the computer sounded a fast-pulsed tone, Heptuna was to keep his peak frequency above a fixed frequency, whereas when the pulses were slow, he kept his peak frequency below a fixed criterion. After intensive training, the experimenters managed to de- velop stimulus control over Heptuna’s click emissions. As a full demonstration that Heptuna had learned this complex behavior, mixed tones and pulse rates signaled him to pro- duce high-level, low-frequency clicks and vice versa. Heptu- na had learned to change his emitted level and peak frequen- cy during an echolocation detection trial and demonstrated conscious control of his echolocation clicks (Figure 5; Moore and Pawloski, 1990).
Because Heptuna could produce high source level clicks, above 200 dB re 1 μPa (at 1 meter), Ken Norris, one of the great pioneers of dolphin echolocation studies, thought that Heptuna could test the prey-stunning theory that he and Bertel Møhl (see the article about Møhl in Acoustics Today by Wahlberg and Au, 2018) had been developing. The hy- pothesis was that with their very high intensity clicks, dol- phins could stun potential prey, making capture much easier. Thus, began a truly exciting experiment involving Heptuna, fish in plastic bags, and suspension devices to hold the bags in front of the animal as he produced very high source level clicks. Bags burst because of bad suspension, sending fresh fish swimming away, with Heptuna giving chase. After many
48 | Acoustics Today | Spring 2019
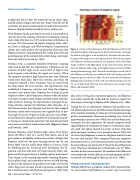
Figure 5. A train of 101 echolocation clicks that Heptuna emitted in the echo detection phase of the experiment. Each horizontal line, starting at the bottom of the figure, is an emitted click. The darker the line colors, the greater the energy across the frequency band. The click train begins with Heptuna emitting narrowband, low-frequency clicks with major energy in the 30- to 60-kHz) region. As the click train evolves (around click 12), Heptuna adds energy in the higher frequencies (at 120 kHz,) emitting bimodal energy clicks. The click train develops around click 20 with Heptuna producing very wideband clicks with energy across the frequency spectrum (30 to 110 kHz). The click train ends with Heptuna shifting (around click 85) to clicks with narrowband energy across the 65- to 110-kHz band. This click train lasted just a few seconds. From Moore and Pawloski (1990).
false starts, the bag size, suspension apparatus, and Heptuna were under control. The results did not, however, support the idea of prey stunning by dolphin clicks (Marten et al., 1988).
During this set of experiments, Heptuna had excellent con- trol of his head placement, and Whit wanted to take advantage of the animal’s stationing to refine his vertical emission beam pattern measurements. Heptuna’s positioning was a level of improvement in accuracy over Whit’s first emitted-beam mea- surements. For this experiment, the control computer would signal Heptuna to echolocate the target (1.3-centimeter-diam- eter solid steel sphere located 6.4 meters in front of the bite plate) and report whether it was present or absent. Whit used six vertical hydrophones to measure Heptuna’s emitted beam for each click emitted. Whit computed Heptuna’s composite beam pattern over 2,111 beam measurements and showed that the vertical beam was elevated by 5° above the line of Heptuna’s teeth. Whit then calculated the vertical beam to be 15° differ- ent from his first measurements. He considered this difference to be attributable to both differences in head anatomy and bet- ter control over stationing by Heptuna (Au et al., 1986a).
Heptuna and “Jawphones”
William (Bill) Evans, a graduate student of Dr. Kenneth Nor- ris, used contact hydrophones in suction cups to measure
