
Page 52 - Spring2019
P. 52
ations
Mayo Equations
Page 13:
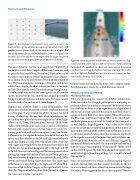
Figure 7. The 24-element hydrophone array used to measure the beam pattern of the dolphin during target detection trials. Left
Heptuna and Biosonar
graphic shows a planar display of the array arc shown at right. Red 2√2𝑟𝑟𝑐𝑐 𝑇𝑇
&' 22𝑟𝑟𝑐𝑐𝑇𝑇
𝑝𝑝=
𝑝𝑝=
Figure 8. Mean amplitude distribution at various points on Hep- tuna’s head. The colors indicate different intensities (with red being the loudest). The numbers are the actual measurements determined at different suction-cup hydrophone locations relative to the loudest sound on the head. Dashed line, area of maximum intensity on Hep- tuna’s melon. From Au et al. (2010).
forward-projected but movable beam with complex energy distributions over which the animal had some control.
Heptuna and Contact
Hydrophones
Whit Au, pursuing his interest in dolphin echolocation clicks, traveled to San Diego to participate in our ongoing ex- periments. First, he wanted to determine the location where the echolocation beam axis emerges from the dolphin head and to examine how signals in the acoustic near field relate to signals in the far field. First, investigators (Brian Branstetter, Jim Finneran, and Moore) helped Whit as he placed vari- ous hydrophone arrays around the heads of Heptuna and a second dolphin, Bugs (Figure 8). Whit collected the clicks from the arrays and computed the position on the melon (a mass in the forehead of all toothed whales that acts as a lens to collimates emitted clicks) where the maximum amplitude of the signals occurred. Whit noted that each dolphin’s am- plitude gradient about the melon was different, suggesting anatomical differences in both the shape of the forehead and that the sound velocity profile of the animal’s melon acted on the emitted signal. Heptuna typically emitted signals with amplitudes higher than those of Bugs by 11-15 dB (Au and Penner, 1981).
Whit also interpreted his results as demonstrating that the animal’s emitted click was first shaped internally by the air sacs in its head and then refined by transmission through the melon. Whit suggested that his results supported Norris’s
𝑓𝑓𝑃𝑃 (1)
&' 𝑓𝑓𝑃𝑃
star in the center denotes the P0 hydrophone, which is aligned with the main axis of the dolphin to the target when the target was placed directly in front of the dolphin at P0. From Moore et al. (2008).
This was a behavior that led to an experiment to identify if the dolphin could detect targets off the main beam axis and to quantify their capabilities. To that end, Heptuna was used to explore emitted-beam control. Investigators (Lois Dankie- wicz, Dorian Houser, and Moore) devised an experiment to have Heptuna once again station on a bite plate and detect echoes from targets placed at various positions to his right and left. This time, he would be echolocating through a ma- trix of hydrophones so that the investigators could examine various parameters of each emitted click at each position in the matrix of hydrophones and determine the beam pattern for each click in his emitted click train (Figure 7).
Heptuna was asked to detect a water-filled stainless steel sphere and a hollow aluminum cylinder. Heptuna stationed on a bite plate that prevented his ability to move his head during echolocation. He was then asked to echolocate tar- gets as they were placed at various angles to his left and right (Moore et al., 2008). Horizontal and vertical −3 dB beam widths were calculated for each click as well as correlations between click characteristics of peak frequency, center fre- quency, peak level, and root-mean-square (rms) bandwidth. Differences in the angular detection thresholds for both the sphere and the cylinder to the left and right were relatively equal, and Heptuna could detect the sphere when it was 21° to the right and 26° to the left. His detection threshold for the cylinder was not as good, being only 13° to the right and 19° to the left. The more interesting result became apparent when plotting his composite horizontal and vertical beam patterns. Both were broader than previously measured (Au et al., 1978, 1986b) and varied during target detection. The center part of the beam was also shifted to the right and left when Hep- tuna was asked to detect targets to the right and left. It was clear that Heptuna’s echolocation clicks formed a dynamic 50 | Acoustics Today | Spring 2019
, ./0
, ./0
√
u
