
Page 33 - Summer2019
P. 33
20 in measured waveforms too. So, is it sufficient to just add
nonlinearity to a rock to describe its behavior? No.
71? 15 There are two additional and important complications to the
% stress-strai.n behavior i.nherent in a rock. The stress-strai.n
V curve i.n Figure 2 was taken at a very slow rate (data were
in 10 . . . .
g acquired over a period of several days). The nonlinearity
,: is clearly present, and the compression phase essentially
0) 5 matches the release phase (within errors). However, the rate
at which the stress-strai.n data are acquired matters. Imagine
repeating the stress-strain measurement in Figure 2, this time
0 linearly, increasing and then decreasing the stress at different
rates and measur' the resultant strain. The results oft '
0'1 0.2 0'? 0'4 0'5 0'6 0'7 data slowly (e.g.,ld]agys) and then quite quickly (e.g., mi
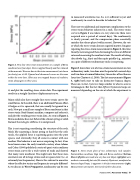
Strain (mm/mm) on a pair of different sedimentary rocks is surprising.
Figure 2. Very slaw stress—strain measurement an a sample afBerea
sandstane (aver four days). Stress is applied linearly and then released Figure 3 shows four sets of stress-strain measurements on two
at the same rate. The errar bars in the strain measurements (nat shawn sedimentary rocks, two done over the period of a several days
far clarity) are :D.D2. Upward and dawnward curves are the same and two done at normal laboratory timescales of less than an
within the error bars. (Plat axes are swapped because af traditian; hour (see Claytor et al., 2009). The fast measurements (Figure
strain always goes an the y—a.xis.) 3, right) both start to take on distinctive banana shapes.
These are, i.n fact, hysteresis loops similar to what is seen i.n
ferromagnets. But the fact that difererit hysteresis loops are
it, and plot the resulting stress-strain data. The experiment measured depending on the rate at which the experiment is
results in a straight-line force-displacement curve.
an 20
Many solids also have straight-line stress-strain curves for
small forces. In the solid, there is an additional Poisson effect, E6 ‘5
it bulges as it is squeezed, that can usually be ignored in a Em W
rock Now put a small core sample of Berea sandstone in that %
stress-strain (load-frame) machine, compress and release it, 5 5 '
and plot the resulting stress-strain data. As seen in Figure 2, U _ _
Berea sandstone does not behave likealinear spring or solid. 0| 02 03 04 05 06 D7 on 02 03 00 05 Us 07
Instead, the rock gets stiffer as it is compressed. ‘V Sm" “"'""'"“’ ‘° Sm" lmmlmmy
s a
This is not surprising considering the structure of the rock f E 5
Much like squeezing a linear spring so hard that the coils E
touch, the applied force is squeezing grains into the pore g 4 ‘
spaces, and eventually, they all come in contact with one 2 2
another. This behavior is not new or surprising. In fact, it has 0
been known since the early twentieth century when Adams °°° “°5S":"‘:’mW;":) °2° °°° °°5S"a“‘"‘:“m/:‘“‘n5‘) M”
and Coker (1906) published a series of quasi-static nonlinear
stress-strain curves for a wide variety of rocks and showed Figure 3. Stress—strain plats af twa sedimentary rock samples:
that many were nonlinear. You might note that these mea- Fantaineizleau sandstune (top, red) and Berea sandstune (bottom,
surements are all i.n large strains and are quasi-static (i.e., at blue). Lzftplots were made ata very slaw rate (days); right plots were
extremely low frequencies). How is this relevant to acoustics made at a reasonably fast rate (30 minutes). Hysteresis, manifested as
where the effective strains and frequencies are quite different? izanana—shaped laaps, is apparent in the fast measurements (right).
As we discuss in Wave Propagation, nonli.nearity can be seen Measurement rate matters. See text far further discussion.
Summer 2019 | Anouudcl Tbrlay 1 11
