
Page 35 - Summer2019
P. 35
7°” hysteresis is present in wave propagation measurements as
600 well as in rate eflects.
- ~ o
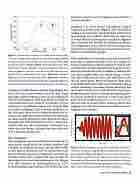
6% 500 » , T ' T n V Rernillieux et ai (2017) showed such behavior at higher
2' ' _ m frequencies and lower strains. Figure 6 shows the results of
-E 400 V , ' . ' sending a tone burst down a long thin Berea sandstone bar.
% 300 V ' ‘ _ The waveforms are recorded 0.5 meter from the source and
§ I at several different increasing source amplitudes. Figure 6,
200 — ‘ _ , ' I A ’ ‘P inset, shows just how distorted the waveform has become.
— ‘ . l ‘ ’ ,_ ’ - ‘ The triangulation is severe, and even the zero crossings have
wgzm 32,5 3220 3225 3230 3235 moved. Further in-depth discussion and more results can be
FFBQUEHEY (HZ) found in the aforementioned paper.
Figure 5. Upmnddown resonance curve data points taken quickly
(2 minutes; orange circles, upward data points; green plus symbols, What sort of physics is causing the peculiar behavior of rocks?
downward data points) and taken very slowly (2 days; lzlue tircles, Recall that a sandstone typically consists of a random col-
upword data points; red plus symbols, downward data points), both lection of quartz grains cemented together in unusual ways,
at the some excitation amplitude. In eontrost with the smooth curve: with odd contact surfaces and porosity for the grains to move
shown in Figure 5, resonance curve data were taken sparsely, paint and rotate around under stress. In addition, a rock may also
lzypoint. Error in measurement is :20 m/s’. Red arrow, resonance have fluids trapped within that matrix during its forma-
frequency fizr theslow experimentat3,239Hz; black arrow, resonance tion. These fluids may also play a role, especially at crack
frequency for the fast experimentot 3,223 Hz, a significant diflerenee. tips and contact points. Bittner and Popovics (2019) made
a remarkable observation under an environmental scanning
electron microscope (a scanning electron microscope that
Examples of the above behavior abound. Depending on how can visualize wet objects) that shows fluids in a cement pore
fast or slow the resonance sweep is done, the slope, jumps, disappearing under acoustic excitation and reappearing after
and shapes of all the resonance curves can vary dramatically the acoustic excitation is turned ofl’. A Video of the experi-
(TenCate and Shankland, 1996). in particular, by doing the ment shows an initially wet pore (youtu.he/I-l_ahCbbYt3Q).
sweep measurements very slowly or very quickly, it was pos- However, when an acoustic field is turned on, all the water
sible to get two very different resonance curves from the same disappears. Once the acoustic field is turned off, water is seen
rock sample (see Figure 5). Rate is the only variable here. In seeping back into the pore.
fact, later work shows that the resonance behaviors at fre-
quencies a.nd amplitudes of most interest to the acoustician 20 fig
are almost entirely dominated by slow-dynamic rate eifects 7 '5 i _> 15
(Pasqualini et al_, 2007; Remillieux et al_, 2017). Classical non- m ; 9 I y E I I g ‘L’ i 3&
linearity of the sort that an acoustician would expect (e.g., 5 5 5, E‘ E: at g _5‘ E I} 3 r’—: ‘ll
which cause sonic booms), although large, takes a back seat E 0 ‘ii 5 'i‘ l ' I ' i' l 4 '7 r‘
to slow dynamics in many cases. T: '5 ll l ' I i‘ l 3 '
= .m ‘ i . l I V
. 51.5 ' ‘ 3 . ‘ i “iii ...
Wave Propagation ..,.. iwij
Wave propagation experiments fall into the second type of ‘Mn in 0.2 0.3 0.4 0 3 my 0 7
measurement carried out by Los Alamos researchers and "'""l"“]
colleagues. Are nonlinear, hysteresis, and rate effects visible Figure 6. Distorted wavefin-ms rnmsured 0.5 mererfrom line source, a
in these kinds of experiments too? Yes indeed, they are all tone burst. sent down a long thin Berea sandstone bar at increasing
present. Numerous papers show nonlinearity in the form of drive amplitudes (blue to red). Inset: zoom of one cycle and shows how
harmonics and at strains roughly 1,000 times less than the distorted time waveforms lzemme. Thespectrum ofthese waveforms is
typical quasi-static stress strain measurements (e.g,, Meegan dominated by odd harmonics. The wavefiirrns also show how thepuke
et al., 1993; TenCate et ai, 1996; Remillieux et al4) 2017). is progressively delayed with inereasingomplitudesatthezero crossings.
Recall that McKavanaugh and Stacey (1974) show that cuspy There is more than nonlinearity present in these waveforms.
Summer 21119 | Aa=:ulfl|:I‘1'b:lIy l 33
