
Page 22 - WINTER2019
P. 22
Utilizing CTBT Hydroacoustic Stations
scientists analyzed the acoustic anomaly and reported the event to the search and rescue (SAR) operation, which com- menced with great international support. Two weeks later, the SAR operation had turned into a recovery mission. This mission ended exactly one year and a day after the sinking, when the San Juan was identified in a side-scan sonar image (see Figure 2). The acoustic signals pinpointed the location of the ARA San Juan to within 1,000th of the total propagation distance, an impressive result that demonstrates the capability of the CTBT network to enforce the nuclear test ban treaty.
So how exactly was the location of the San Juan determined from the hydroacoustic recordings? In part, the triplet design of the IMS stations (see Figure 1) measures the direction of arrival (DOA) of incoming sound energy. This information helps to associate signals that, due to the geographic depen- dence of dispersion, appear very different to the same event. A general area from the two station detections is established by the intersection of the geodesics along the DOA, but real precision in location comes from triangulation (which
requires at least three detections). With this in mind, let us examine the method used to triangulate a sound impulse of unknown origin.
Triangulation of Unknown Acoustic Events
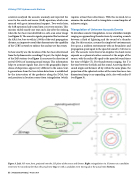
To introduce acoustic triangulation, we use a familiar example, ranging an approaching thunderstorm by counting seconds between a flash of lightning and the sound of a thunder- clap. For this exercise, assume the simplest of environments, free space, a uniform environment with no boundaries and propagation speed equal to the speed of sound (c; 340 m/s in air). The acoustic wave front of an impulse (its shock wave) expands as a spherical surface centered at the origin of the source, with the radius (R) equal to the speed of sound times the time-of-flight (T). For thunderstorm ranging, the T is the time between the flash and the sound. Asserting that the sound origin and listeners all lay within the same plane, the projection of the spherical surface of the wave front on a two- dimensional map is an expanding circle, also with radius R (see Figure 3).
Figure 3. Left: 3-D wave front, projected onto the 2-D plane of the source and listener. Right: triangulation via 3 listeners at a candidate event time 0.5 seconds earlier than the actual time (top) or with a candidate event time equal to the actual time (bottom).
22 | Acoustics Today | Winter 2019
