
Page 49 - Summer2020
P. 49
introduced tuning fork tests in which the stem of a vibrating tuning fork is touched to various places on a patient’s skull to measure bone conduction; these tests have since become standard tools for the clinical assess- ment of hearing loss (Feldmann, 1997b,c). Similarly, in 1903, Rydel and Seiffer introduced a tuning fork with a graduated scale at the tines that is currently used to measure nerve conduction in the hands and feet (Mar- tina et al., 1998).
From an educational viewpoint, the tuning fork has long been an important apparatus for demonstrations and experiments in undergraduate physics courses. Lin- coln (2013) lists several tuning fork activities, including using an adjustable strobe light to see the tines vibrating; using a microphone and an oscilloscope to observe the frequencies of a fork and the variation in intensity as the fork is rotated; using a fork with a resonator box (Bogacz and Pedziwaitr, 2015) to demonstrate sympathetic reso- nance and beats; attaching a mirror to one of the tines to reproduce the original Lissajous figures; measuring the speed of sound with a fork and a cylindrical tube partly filled with water; and observing how the frequency of a fork depends on temperature.
Fork Frequencies, Tine Length, and Material Properties
The frequency (f) of a tuning fork depends on its material properties and dimensions according to
(1)
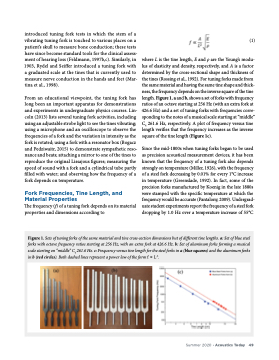
where L is the tine length, E and ρ are the Young’s modu- lus of elasticity and density, respectively, and A is a factor determined by the cross-sectional shape and thickness of the tines (Rossing et al., 1992). For tuning forks made from the same material and having the same tine shape and thick- ness, the frequency depends on the inverse square of the tine length.Figure1,aandb,showsasetofforkswithfrequency ratios of an octave starting at 256 Hz (with an extra fork at 426.6 Hz) and a set of tuning forks with frequencies corre- sponding to the notes of a musical scale starting at “middle” C4 261.6 Hz, respectively. A plot of frequency versus tine length verifies that the frequency increases as the inverse square of the tine length (Figure 1c).
Since the mid-1800s when tuning forks began to be used as precision acoustical measurement devices, it has been known that the frequency of a tuning fork also depends strongly on temperature (Miller, 1926), with the frequency of a steel fork decreasing by 0.01% for every 1°C increase in temperature (Greenslade, 1992). In fact, some of the precision forks manufactured by Koenig in the late 1880s were stamped with the specific temperature at which the frequency would be accurate (Pantalony, 2009). Undergrad- uate student experiments report the frequency of a steel fork dropping by 1.0 Hz over a temperature increase of 55°C
Figure 1. Sets of tuning forks of the same material and tine cross-section dimensions but of different tine lengths. a: Set of blue steel forks with octave frequency ratios starting at 256 Hz, with an extra fork at 426.6 Hz. b: Set of aluminum forks forming a musical scale starting on “middle” C4 261.6 Hz. c: Frequency versus tine length for the steel forks in a (blue squares) and the aluminum forks in b (red circles). Both dashed lines represent a power law of the form f ∝ L-2.
Summer 2020 • Acoustics Today 49
