
Page 57 - Summer2020
P. 57
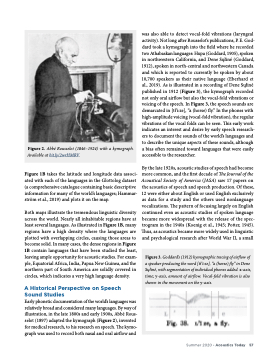
   Figure 2. Abbé Rousselot (1846–1924) with a kymograph. Available at bit.ly/2wrHMRV.
 Figure 1B takes the latitude and longitude data associ- ated with each of the languages in the Glottolog dataset (a comprehensive catalogue containing basic descriptive information for many of the world’s languages; Hammar- ström et al., 2019) and plots it on the map.
Both maps illustrate the tremendous linguistic diversity across the world. Nearly all inhabitable regions have at least several languages. As illustrated in Figure 1B, many regions have a high density where the languages are plotted with overlapping circles, causing those areas to become solid. In many cases, the dense regions in Figure 1B contain languages that have been studied the least, leaving ample opportunity for acoustic studies. For exam- ple, Equatorial Africa, India, Papua New Guinea, and the northern part of South America are solidly covered in circles, which indicates a very high language density.
A Historical Perspective on Speech Sound Studies
Early phonetic documentation of the world’s languages was relatively broad and considered many languages. By way of illustration, in the late 1800s and early 1900s, Abbé Rous- selot (1897) adapted the kymograph (Figure 2), invented for medical research, to his research on speech. The kymo- graph was used to record both nasal and oral airflow and
was also able to detect vocal-fold vibrations (laryngeal activity). Not long after Rousselot’s publications, P. E. God- dard took a kymograph into the field where he recorded two Athabaskan languages: Hupa (Goddard, 1905), spoken in northwestern California, and Dene Sųłiné (Goddard,
1912), spoken in north-central and northwestern Canada and which is reported to currently be spoken by about 10,700 speakers as their native language (Eberhard et al., 2019). As is illustrated in a recording of Dene Sųłiné published in 1912 (Figure 3), the kymograph recorded not only oral airflow but also the vocal-fold vibrations or voicing of the speech. In Figure 3, the speech sounds are demarcated in [tɬ’i:ze], “a (horse) fly.” In the phones with high-amplitude voicing (vocal-fold vibration), the regular vibrations of the vocal folds can be seen. This early work
indicates an interest and desire by early speech research- ers to document the sounds of the world’s languages and to describe the unique aspects of these sounds, although a bias often remained toward languages that were easily accessible to the researcher.
By the late 1920s, acoustic studies of speech had become more common, and the first decade of The Journal of the Acoustical Society of America (JASA) saw 17 papers on
the acoustics of speech and speech production. Of these, 12 were either about English or used English exclusively as data for a study and the others used nonlanguage vocalizations. The pattern of focusing largely on English continued even as acoustic studies of spoken language
became more widespread with the release of the spec- trogram in the 1940s (Koenig et al., 1945; Potter, 1945). Thus, as acoustics became more widely used in linguistic and psychological research after World War II, a small
 Figure 3. Goddard’s (1912) kymographic tracing of airflow of a speaker producing the word [tɬ’i:ze], “a (horse) fly” in Dene Sųłiné, with segmentation of individual phones added. x-axis, time; y-axis, amount of airflow. Vocal-fold vibration is also shown in the movement on the y-axis.
 Summer 2020 • Acoustics Today 57
