
Page 40 - Winter 2020
P. 40
KURTOSIS METRIC IN NOISE ANALYSIS
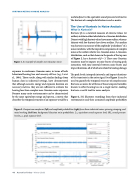
Figure 1. An example of complex non-Gaussian noise.
exposure to continuous Gaussian noise, in terms of both behavioral hearing loss and sensory cell loss (e.g., Lei et al., 1994). These results, along with similar findings from human data in industrial settings, have demonstrated that although acoustic energy and exposure duration are necessary metrics, they are not sufficient to evaluate the hearing loss from complex non-Gaussian noise exposure. Because many noise environments can be characterized by the same equivalent energy and spectra, a metric that describes the temporal structure of an exposure would be a
useful adjunct to the equivalent sound pressure level metric. The kurtosis of a sample distribution is such a metric.
The Use of Kurtosis in Noise Analysis
What is Kurtosis?
Kurtosis (β) is a statistical measure of extreme values (or outliers) in data in either tail relative to a Gaussian distribution. Datasets with high kurtosis values have more outliers, whereas datasets with low kurtosis have fewer outliers. Put another way, kurtosis is a measure of the amplitude “peakedness” of a noise waveform, with the impulsive components of complex noise as the outliers relative to a Gaussian noise. A Gaussian distribution, such as that shown in the panels of the top row of Figure 2, has a kurtosis of β = 3. These non-Gaussian transients may be impacts or noise bursts of varying peak intensities, with time intervals between noise bursts and impact durations, all of which are related to hearing damage.
The peak levels, interpeak intervals, and impact durations of the transients in the noise signal (see Figure 1) can be used to quantify the temporal structure of complex noise. Kurtosis accounts for all three of these temporal variables known to affect hearing loss in a single metric, making kurtosis a useful tool for noise analysis.
Figure 2, left, illustrates recordings from three industrial environments and their associated amplitude probability
Figure 2. Comparison waveforms (left) and amplitude probabilities (right) from three industrial noises: spinning, stamping, and metal working. Red lines, background Gaussian noise probabilities. Leq, equivalent sound exposure level; SPL, sound pressure level; Lpeak, peak exposure level.
40 Acoustics Today • Winter 2020
