
Page 41 - Winter 2020
P. 41
histograms on a logarithmic scale (Figure 2, right): spinning (β = 3), stamping (β = 26), and metal working (β = 55). The amplitude probability histograms show the probability that a varying noise exposure exists at a specific amplitude value. The kurtosis of the recorded noise was computed over nonoverlapping consecutive 40-second time windows using a sampling rate of 48 kHz. The kurtosis value for each noise exposure was obtained using the mean of the measured kurtosis values. The waveforms in the panels on the right side of Figure 2 show that the noise amplitude distributions with heavier tails have higher kurtosis values.
Researchers have shown that impulsive noise can cause more damage to hearing than steady-state noise (e.g., Taylor et al., 1984; Hamernik and Qiu, 2001). In an industrial noise environment, however, the definition of impulsive noise is often vague, and this affects the accuracy of any noise-induced hearing loss evaluation. Evaluating the hazards of impulsive noise then requires first designing a criterion to categorize the exposure as impulsive or nonimpulsive. To do this, Erdreich (1986) presented a distribution-based definition of impulsive noise and demonstrated that kurtosis was a sensitive discriminator of the impulsiveness of noise. The advantage of using kurtosis is that it accounts for the contribution of all peaks as well as the relative difference between peak and background levels. Although kurtosis was identified as a reasonable criterion for differentiating between impulsive and nonimpulsive noise, it still did not solve the problem of evaluating noise-induced hearing loss. Most industrial noises are complex, non-Gaussian noises with varying temporal structures that cannot be simply divided into impulsive and nonimpulsive noise.
Experiments Using Kurtosis
Over recent decades, much of the research in the area of noise-induced hearing loss has involved animal models, particularly the chinchilla, because its audibility curve and reactions to noise are similar to those of humans. Effects from these kinds of experiments are usually measuredintermsofnoise-relateddamagetothedelicate microstructures, the ciliated cells, or cochlear outer hair cells of the inner ear.
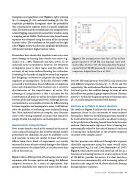
Figure 3 shows differing levels of hearing loss due to noise exposures with the same spectra and energy but different temporal structures. In a series of experiments, four groups of chinchillas were exposed to noise with the same
level (97 dB sound pressure level [SPL]) and spectra but with different temporal structures (β = 3, 25, 50, and 100, respectively). The results showed that for the same exposure level and spectra, the cochlear damage in terms of outer hair cell loss was greater in groups exposed to non-Gaussian noise (β > 3) than for the group exposed to Gaussian noise (β = 3), and hearing loss increased with kurtosis.
Kurtosis as a Metric in Noise Analysis
The results in Figure 3 indicate that kurtosis can be an important factor in the assessment of noise-induced hearing loss. However, the following questions needed to be resolved for kurtosis to be used as an adjunct to energy in the prediction of hearing hazard from both Gaussian and non-Gaussian noise exposures. First, is hearing loss monotonically related to the value of kurtosis? And next, is hearing loss independent of the detailed temporal structure of the complex noise?
The first question was addressed through four separate chinchilla experiments using the same overall noise exposure level (e.g., Lei et al., 1994; Hamernik et al., 2007). Figure 4, which shows mean total outer hair cell loss as a function of increasing kurtosis at a noise exposure level of 100 dB(A), provides the answer. It is clear that these losses increase monotonically with increasing values of kurtosis in the range of 3 to 50, above which the hearing damage appears to plateau.
Figure 3. The average percent outer hair cell loss of three groups exposed to 97 dB SPL non-Gaussian noise with kurtosis (β) = 25, 50, or 100. The mean data from the group exposed to the 97 dB SPL Gaussian (β = 3) noise is shown for comparison. Adapted from Qiu et al., 2013.
Winter 2020 • Acoustics Today 41
