
Page 54 - Fall2021
P. 54
DAVID M. GREEN
Figure 4. Stimulus-response table indicating Hits, Misses, False Alarms, and Correct Rejections and their conditional probabilities, i.e., P (“Response”/Stimulus), in detecting (“Yes” or “No”) whether a signal plus noise (SN) or noise alone (NA) was presented.
Hits and False Alarms. Clearly, if the Hit probability is high and the False Alarm probability is low, the observer had little difficulty correctly determining when the signal was and was not presented, and, thus, the observer was sensi- tive to the signal being presented.
However, consider a “conservative” observer who is reluc- tant to indicate the presence of a signal independent of his/her sensitivity versus a “liberal” observer who is very willing to indicate that a signal is present. Clearly, the observers have different response “biases” for indicat- ing if a signal was or was not present. Assuming that the observers are equally sensitive, the conservative observer will have lower Hit and False Alarm probabilities than the liberal observer. Thus, Hits and False Alarms vary with changes in both sensitivity and response bias (they are independent measures of performance). How might Hit and False Alarm probabilities be combined to provide a single measure of how well the observer detected the signal (i.e., estimate sensitivity) independent of response bias?
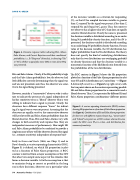
Early in Green and Swets (1966, see Chap. 2) and in Dave’s homily, a receiver operating characteristic (ROC; Figure 5) is defined, on which Hit proportion is plot- ted as a function of False Alarm proportion. A ROC contour is derived from a major assumption of the SDT that observers sample some aspect of the stimulus that forms a decision variable. A further assumption is that to maximize being as correct as possible in the long run in their decisions, observers use a particular value
of the decision variable as a criterion for responding (C), so that if the sampled decision variable is greater than C, respond Yes the signal was present; if less than C, respond No; and if equal to C, guess. Thus, the conserva- tive observer has a higher value of C than does an equally sensitive liberal observer. If only the noise is presented, the decision variable is distributed according to an under- lining NA probability density function, and if the SN is presented, the decision variable is distributed according to an underlying SN probability density function. For any value of the decision variable, the SN distribution has higher probabilities than the NA distribution. The theory does not specify the kind of underlying distributions, only that the two distributions are overlapping probabil- ity density functions and that the decision variable is a monotonic function of the likelihood ratio formed from the probabilities of the two distributions.
The ROC contour in Figure 5 shows the Hit proportion plotted as a function of the False Alarm proportion for arbi- trary SN and NA distributions as C varies from −∞ (Figure 5, bottom left corner) to +∞ (Figure 5, top right corner), with the two points shown on the contour representing possible Hit and False Alarm proportions for a conservative and a liberal observer. Thus, C is represented by different Hit and False Alarm proportion combinations (different points)
Figure 5. A receiver operating characteristic (ROC) contour showing Hit proportion as a function of False Alarm proportion (see Figure 4). Combinations of Hit and False Alarm proportions for observers with different response biases (e.g., “Conservative” and “Liberal”) are points on a ROC contour, whereas the area under the ROC curve (PA) is a bias- and distribution-free measure of sensitivity.
54 Acoustics Today • Fall 2021
