
Page 47 - Winter 2020
P. 47
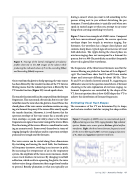
  Figure 6. Tracings of the lateral midsagittal articulatory profiles observed in the MR images of the subject while producing the indicated values of FE in the ascending (blue) and descending (black) sequences.
On its way from the glottis to the lip opening, the voice source has been filtered by the transfer function of the VT. Inverse filtering means that the radiated spectrum is filtered by the
VT transfer function (Figure 2C) turned upside down.
The transfer function itself can be computed from the formant frequencies. This may sound a bit circular, but it is not. Glot- tal airflow must be zero when the glottis is closed. Hence the closed phase of the voice source waveform contains no ring- ing at a formant frequency if the inverse filter exactly equals the transfer function. Moreover, it is well-known that the spectrum envelope of the voice source has a smooth spec- trum envelope, so peaks and valleys close to the formant frequencies are signs of inaccurate tuning of the inverse filters.
Thus fine tuning of the inverse filters is a condition for reach- ing an accurate result. Errors reveal themselves in terms of ringing during the closed phase and/or a spectrum envelope peak and/or a trough near the formants.
The voice source can be varied along three dimensions. By stretching and tensing the vocal folds, the fundamen- tal frequency increases, resulting in an increase in pitch. By increasing the overpressure of air in the respiratory system, the amplitude of the voice source increases, which causes vocal loudness to increase. By changing vocal fold adduction, which results in squeezing the glottis, the voice timbre varies along a dimension that ranges from breathy to pressed. Breathy phonation is what you typically use
during a concert when you want to tell something to the person sitting next to you without disturbing the per- formance. Pressed phonation is typically used when you speak in excited anger or when you attempt to say some- thing when carrying something very heavy.
Figure 7 shows two examples of AMH’s voice. Compared with her conversational speech, the source spectrum envelope slopes less steeply in overtone singing. Fur- thermore, the waveform has a longer closed phase and contains sharp knees, typical signs of an increase of vocal fold adduction. The ripple during the closed phase on overtone singing does not correspond to a formant fre- quency, but to a 900-Hz periodicity, an artifact frequently observed in glottal flow waveforms.
The frequencies of the three lowest formants used for the inverse filtering are plotted as function of FE in Figure 7, right. The trend lines show that F2 and F3 have similar slopes and intercepts differing by about 185 Hz. Thus F2 and F3 are closely clustered around FE, suggesting an affirmative answer to the question raised above, if formant clustering is the sole explanation of overtone singing. As formant frequencies are controlled by the shape of the
VT, the next question then is how AMH shapes her VT to achieve this distribution of formant frequencies.
Estimating Vocal Tract Shapes
The resonances of the VT are determined by its shape, and we have excellent tools for varying this shape within
 Figure 7. Examples of AMH’s voice in conversational speech (left) and during overtone (OT) singing (center). Top: radiated spectra. Center: voice source spectra; Bottom: glottal airflow waveforms. Right: the three lowest formant frequencies used for the inverse filtering of AMH’s overtone singing as functions of FE. Lines and equations represent trend lines.
 Spring 2021 • Acoustics Today 47
