
Page 22 - Winter2021
P. 22
AS THE WIND BLOWS
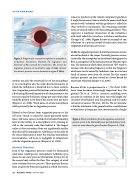
Figure 3. Diagram of a screened microphone in atmospheric turbulence. Streamlines illustrate the stagnation and distortion of flow around the windscreen. The sources for stagnation pressure are localized to region I (red), whereas the intrinsic pressure sources dominate in region II (blue).
involves not only the windward face of the microphone or its covering but also the wind diverted around it, in which the turbulence is distorted due to local accelera- tion. Stagnation pressure fluctuations can be modeled by a fluctuating Bernoulli equation such that pressure at the sensor is equal to the kinetic energy per unit volume that would be present in the flow if the sensor were not there (Raspet et al., 2008). Wind noise on a bare microphone will be primarily due to stagnation pressure.
Related to but distinct from stagnation pressure is the self-noise, which is caused by sensor-generated turbu- lence. Self-noise sources include the turbulent boundary layer on the surface of a microphone or its covering as well as the unsteady wake flow behind it. The largest scales in these secondary flows are significantly smaller than those of the atmospheric turbulence, on the order of the sensor dimension at most. For outdoor microphone measurements, self-noise is negligible in comparison with the stagnation pressure (Raspet et al., 2006).
Intrinsic Pressure
Even if the stagnation pressure could be eliminated, wind noise would persist. Atmospheric turbulence pro- duces its own static pressure fluctuations irrespective of the sensor body within the flow. This category of wind noise is termed intrinsic pressure. These pressure fluctua- tions are given by Poisson’s equation in which the source
terms are products of the velocity component gradients. A single linear source term in which the mean wind shear interacts with turbulent velocity gradients is called the
shear-turbulence mechanism. The remaining contribu- tions are second order in the fluctuating gradients. They represent a nonlinear interaction of the turbulence with itself called the turbulence-turbulence mechanism (George et al., 1984). Figure 4 shows an example of con- tributions to a spectral model of wind noise from the stagnation and intrinsic pressures.
Unlike the stagnation pressure, the intrinsic pressure sources are not localized at the sensor. Unsteady pressure sources received by the microphone are distributed throughout the flow, a consequence of the intrinsic pressure Poisson’s equa- tion. The distance at which these sources are “felt” tends to increase with decreasing frequency so that low-frequency wind noise can be caused by turbulence tens or even hun- dreds of meters away from the sensor. For this reason, intrinsic pressure can been viewed as a lower bound for wind noise reduction (Raspet et al., 2006).
Because dU/dz is proportional to z−1, the shear turbu- lence term becomes increasingly important near the ground (Yu et al., 2011a). Accurate modeling must account for variation in the shear rate with height, the structure of turbulence near the ground, and the nonlo- cal nature of sources (Yu et al., 2011b). The net outcome is that for wind noise at the ground surface, contributions to wind noise at frequency f are concentrated at a height
Figure 4. Plot of contributions from the stagnation and intrinsic pressure sources to the total model power spectral density of wind noise one meter above the ground surface (Raspet et al., 2008).
22 Acoustics Today • Winter 2021
