
Page 21 - Winter2021
P. 21
the PBL depth varies widely, from tens of meters to sev- eral kilometers, almost all outdoor sound is recorded in the PBL. Over land, the typical PBL wind speed varies diurnally, with higher wind speeds during the day than at night.
Wind in the PBL is almost always turbulent. This means that the wind velocity fluctuates continuously as a random process with irregularity in both space and time. Gusts are local peaks in this irregular wind. Averaging reveals a mean wind speed (U) that increases with height (z) above the ground. The mean shear rate (dU/dz), the gradient in wind speed with height, is approximately pro- portional to z −1 in windy conditions. Mean shear has an important role in the production of wind noise.
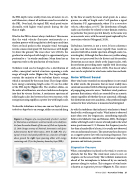
Turbulent wind can be thought of as a distribution of eddies, conceptual vortical structures spanning a wide range of length scales (Figure 2a). The largest eddies contain the majority of the turbulent kinetic energy, which is sustained by the mean shear. These large eddies have energy-containing length scales (𝓛) on the order of the PBL depth (Figure 2b). The smallest eddies, on the order of millimeters, are where turbulence dissipates into heat by viscous friction. A continuous spectrum of eddy length scales lies between these two extremes, with energy increasing rapidly as a power law with length scale.
To describe turbulence in time, one can use Taylor’s frozen turbulence hypothesis: on average, eddies are carried along
by the flow at nearly the mean wind speed. As a conse- quence, an eddy of length scale l will produce a signal of duration l/Uc, approximately, where Uc is a convection velocity, often taken as 0.7U. The distribution of length scales can therefore be related to time-domain statistics, in particular the power spectral density, in the same way as an acoustic wave, with the sound speed replaced by the convectionvelocity(Wyngaard,2010).
Turbulence, however, is not a wave. It loses coherence in space and time much more rapidly than would an acoustic field with a similar spectrum of length scales (i.e., wavelengths). Although the flow does carry eddies along, they are not preserved but do distort and decorrelate. Distortion occurs most slowly at the largest scales, with decorrelation proceeding more rapidly with decreasing eddy scale (Mathieu and Scott, 2000). This loss of coher- ence can be exploited in wind noise reduction methods.
Noise Without Sound
Most wind noise recorded on microphones is not sound. In other words, the pressures that are most readily mea- sured and associated with the blowing wind are not a result of propagating acoustic waves. Turbulent wind produces pressure fluctuations, which are recorded by an acoustic sensor regardless of whether they are acoustical. Although this distinction may seem academic, it has profound impli- cations for how wind noise is measured and mitigated.
As with the turbulence that induces it, wind noise is broad- band with a wide range of scales. Wind noise is observed most often over low frequencies, contributing typically below a few kilohertz (Luo and Nehorai, 2006). The largest eddies with length scale 𝓛 ensure a broad peak in the wind noise spectrum near Uc /𝓛. Because this frequency can be less than a hundredth of a hertz, it is usually not observed, even on infrasound sensors. The spectrum then decreases as a negative power law with increasing frequency. Two distinct mechanisms contribute to wind noise: stagnation pressure and intrinsic pressure.
Stagnation Pressure
When a microphone is placed in the wind, it creates an obstacle for the flow. The wind must come to rest, or stagnate, on the sensor body. The turbulent momentum ahead of the microphone is balanced by an unsteady pressure along its surface. This category of wind noise is known as stagnation pressure (Figure 3). This source
Figure 2. a: Diagram of a conceptual eddy of scale l, overlaid for illustration on a kilometer-scale horizontal vortex shed from the Juan Fernandez Islands off the coast of Chile on September 15, 1999. Image courtesy of National Aeronautics and Space Administration Earth Observatory, 2000. b: Left: Plot of a typical vertical wind speed profile (U) as a function of height above ground (z); right: layer-spanning eddies with energy- containing scale (𝓛) in the planetary boundary layer (PBL).
Winter 2021 • Acoustics Today 21
