
Page 40 - Winter2021
P. 40
WAVE PROPAGATION IN RANDOM MEDIA
Figure 2. Wave propagation in a randomly inhomogeneous medium. Orange and yellow, positive and negative sound speed fluctuations, respectively.
Introduction to Wave Propagation in Random Media
Consider a plane wave with amplitude A0 and phase φ0 traveling in the +x direction in a homogeneous medium. The sound pressure is given by p0=A0 cos(k0x−ωt+φ0), where k0=ω/c0 is the wavenumber, c0 is the sound speed in the homogeneous medium, ω is the angular frequency, and t is time. When the plane wave propagates (Figure 2) through a randomly inhomogeneous medium with sound speed c=c(x,y,z,t), where y and z are the coordinates per- pendicular to x, the amplitude A and phase φ are perturbed from their original values (A0 and φ0, respectively). The
wave front propagates faster through the inhomogeneities where the sound speed fluctuation is positive and slower where it is negative. As a result, the initially plane wave front distorts (Figure 2). Where the distorted wave front is locally concave, the sound is focused and the amplitude increases; where it is locally convex, the sound is defocused and the amplitude decreases. Fluctuations in the velocity of the medium (wind in the atmosphere, current in the ocean) produce similar effects.
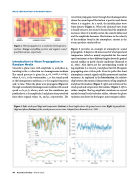
Figure 3 provides an example of atmospheric sound propagation. It depicts a 28-min record of wind speed and temperature (which is mainly responsible for the sound speed variations) at three different heights above the ground around midday in partly cloudy conditions (Kamrath et al., 2021). Also shown are the corresponding records of log amplitude [i.e., ln(A/A0)] and phase for 600-Hz signals propagating over a 68-m path. Even for paths this short, atmospheric acoustic signals exhibit pronounced random variations. As explained in the Introduction, the relation- ship between the statistical characteristics of log-amplitude and phase fluctuations (Figure 3, right) and statistics of the wind speed and temperature fluctuations (Figure 3, left) is rather complex. The log-amplitude variations are caused mainly by small-scale turbulent eddies, whereas the phase variations are driven by the largest, most energetic eddies.
Figure 3. Left: wind speed (top) and temperature (bottom) at three heights above the ground versus time. Right: log amplitude (top) and phase (bottom) of the sound pressure versus time. Adapted from Kamrath et al., 2021.
40 Acoustics Today • Winter 2021
