
Page 44 - Winter2021
P. 44
WAVE PROPAGATION IN RANDOM MEDIA
different paths will experience different fluctuations from the random ocean.
Armed with the GM spectrum, the next major break- through was provided by Munk and Zachariasen (1976) who used the Rytov method and integrated all the ocean factors: internal waves, inhomogeneity (variation with position), anisotropy (variation in direction), a disper- sion relation, and a waveguide. The result was a first-order description of the ocean weak-fluctuation (unsaturated) regime, and the calculations they carried out were in agreement with the available observations and the Monte Carlo simulation mostly to within factors of 2. The strong fluctuation and saturation regimes were analyzed soon thereafter by Flatté and Dashen using the Feynman path integral methods (Flatté et al., 1979; Flatté, 1983a) and by
Dozier and Tappert (1978) using coupled mode theory. Remarkably, although some of the details changed, this follow-on work, especially path-based treatments, main- tainedastrongconnectiontothephysicalpictureprovided by the Munk and Zachariasen (Rytov) formulation.
A fascinating outgrowth of this theoretical work was that acoustical field statistical moments could be expressed analytically in terms of specific ocean process parameters such as internal waves, leading to the suggestion of inter- nal-wave tomography (Munk et al. 1981; Flatté 1983b). This contrasts with previous work in which the acousti- cal moments were written in terms of ad hoc correlation functions divorced from ocean dynamics. During this time, there was a blossoming of acoustic remote sensing (Clay and Medwin, 1977), leading to a new field, acoustical
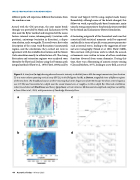
Figure 8. A time front (a: top) showing observed acoustic intensity in decibels from a 450-km range transmission from location T3 to a water column spanning vertical array (DVLA) in the Philippine Sea (b). a: Bottom, magnified views of different regions of the time front. The broadband sources at the T-moorings had center frequencies of 250 Hz (except T2 whose center frequency was 170 Hz) and transmitted at a depth near the sound channel axis at roughly a 1,000-m depth (b). Observed scintillation index (c) and observed (black lines) and theory (gray lines) vertical coherence (d) demonstrate amplitude and phase variability. a From Colosi et al., 2019, with permission of Cambridge University Press.
44 Acoustics Today • Winter 2021
