
Page 49 - Winter2021
P. 49
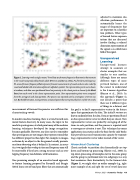
  Figure 1. Learning vowels using k-means. Vowel data are formant frequencies (harmonics that resonate in the vocal tract) produced by female adults (Peterson and Barney, 1952). F1, first formant frequency; F2, second formant frequency. Dots represent formant measurements of vowels and are color coded by vowel and labeled with international phonetic alphabet symbols. Ten representative points were chosen at random, and data were partitioned based on proximity to the closest point as shown by the black lines from each vowel to the closest representative point. New representative points were computed from the average of each data partition. The process was repeated until a convergence criterion was met. By the fifth iteration, most partitions contained points that were primarily from 1 of the 10 vowels.
measurement of formant frequencies was sufficient for characterizing vowels.
In modern machine learning, there is a trend toward auto- mated feature discovery. In many cases, the input to the model is spectrograms, at which point many of the machine learning techniques developed for image recognition become applicable. However, one does need to remember that spectrograms are not images; they represent sound that has different properties than light. For example, in images, occlusion by an object in the foreground usually prevents one from observing what is behind it. In contrast, in acous- tics, two signals that overlap in time and frequency may still be recoverable if they have a strong structure such as over- lapping frequency modulations with harmonics.
One promising example of an acoustics-based approach to feature learning proposed by Ravanelli and Bengio (2018) learns sets of band-pass filters that are automatically
adjusted to maximize clas- sification performance. It automatically learns the ranges of frequencies that are important to a classifica- tion problem. Other types of learned feature represen- tations that are discussed involve finding a reduced dimension representation of the signal, a so-called mani- fold of the signal.
Unsupervised Learning Unsupervised learners attempt to associate or cluster examples that are similar to one another.
Although there are many different types of unsu- pervised learners, one of the easiest to understand is the k-means algorithm (Bianco et al., 2019). In this approach (Figure 1), one decides a priori that there are k different types of things in a dataset, and
the goal is to find k representative vectors in the feature space that approximate the data. The initial k vectors are drawn randomly from the data. Data are partitioned based on the representative vector to which they are closest. New representative vectors are picked by averaging all of the items in each partition, and the process is repeated until a convergence criterion is met. This technique has many applications in acoustics and is the basis for the code books that provide increased transmission capacity by transmit- ting a representative vector index instead of the vector.
Hierarchical Clustering
Classic methods to partition data hierarchically are top- down and bottom-up processing (Hastie et al., 2009). In top-down processing, all examples start in the same group and the group is partitioned into two subgroups in a way that maximizes their dissimilarity. In the formant data (Figure 1), we might select an outlier example (e.g., right- most example of æ) and split the set of vowel data into
Winter 2021 • Acoustics Today 49
