
Page 51 - Winter2021
P. 51
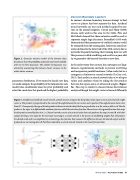
  Figure 2. Gaussian mixture models of the formant data. Isocontours show the probability surfaces for each vowel modeled with one to three Gaussians. The number of Gaussians was selected by maximizing the between cluster variance to the within cluster variance.
parametric distribution. If we wanted to classify new data, we would compute the probability of the formants for each model (class conditional) times the prior probability and select the vowel class that produced the highest probability.
Decision Boundary Learners
In contrast, decision boundary learners attempt to find curves or planes that best separate the data. Artificial neural networks are one such method inspired by neu- rons in the animal kingdom. Cowan and Sharp (1988) discuss early work in this area. In the 1940s, Pitts and McCulloch showed that these networks could be used to represent simple logic functions. Rosenblatt’s 1953 work demonstrated that parameters of artificial neurons could be estimated from the training data. Interest in neural net- works declined in the latter half of the 20th century due to networks frequently learning their training data too well.
This process is called overfitting and results in a poor abil- ity to generalize the learned function to new data.
In the early twenty-first century, the convergence of large datasets, regularization methods to prevent overfitting, and inexpensive parallel hardware (video cards) led to a resurgence of interest in neural networks (LeCun et al., 2015). Each node in a neural network takes a set of input values and combines them by taking the dot product between the inputs and a set of learned weights (Figure 3a). This step is similar to classical linear discriminant analysis although the weight vector is learned differently.
 Figure 3. A feedforward artificial neural network. a: Each neuron computes the dot product of an input vector x and a learned weight vector w. The product is proportional to the cosine of the angle between the two vectors and is positive if the angle between them is less than 90°. Consequently, the sign of the dot product indicates to which side of the line perpendicular to w the vector x falls on. b: The dot product is the input to a differentiable nonlinear function called the activation function. Shown here is the sigmoid function that maps the dot product smoothly from 0 to 1. c: Neural networks consist of a series of nodes that each performs the steps in a and b, with their outputs forming a new input for the next layer. Learning in a neural network is the process of establishing weights that will produce the desired result and is accomplished my minimizing a loss function that measures the difference between the desired output and the produced one on training data. d: Partitions induced by a neural network trained on the vowel formant data.
    Winter 2021 • Acoustics Today 51
