
Page 61 - Spring2022
P. 61
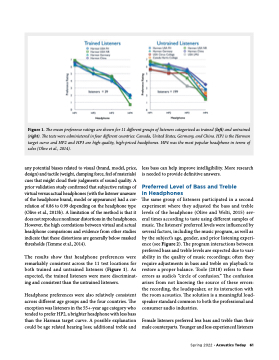
  Figure 1. The mean preference ratings are shown for 11 different groups of listeners categorized as trained (left) and untrained (right). The tests were administered in four different countries: Canada, United States, Germany, and China. HP1 is the Harman target curve and HP2 and HP3 are high-quality, high-priced headphones. HP4 was the most popular headphone in terms of sales (Olive et al., 2014).
any potential biases related to visual (brand, model, price, design) and tactile (weight, clamping force, feel of materials) cues that might cloud their judgments of sound quality. A prior validation study confirmed that subjective ratings of virtual versus actual headphones (with the listener unaware of the headphone brand, model or appearance) had a cor- relation of 0.86 to 0.99 depending on the headphone type (Olive et al., 2013b). A limitation of the method is that it does not reproduce nonlinear distortions in the headphones. However, the high correlations between virtual and actual headphone comparisons and evidence from other studies indicate that these distortions are generally below masked thresholds (Temme et al., 2014).
The results show that headphone preferences were remarkably consistent across the 11 test locations for both trained and untrained listeners (Figure 1). As expected, the trained listeners were more discriminat- ing and consistent than the untrained listeners.
Headphone preferences were also relatively consistent across different age groups and the four countries. The exception was listeners in the 55+-year age category who tended to prefer HP2, a brighter headphone with less bass than the Harman target curve. A possible explanation could be age related hearing loss; additional treble and
less bass can help improve intelligibility. More research is needed to provide definitive answers.
Preferred Level of Bass and Treble in Headphones
The same group of listeners participated in a second experiment where they adjusted the bass and treble levels of the headphone (Olive and Welti, 2015) sev- eral times according to taste using different samples of music. The listeners’ preferred levels were influenced by several factors, including the music program, as well as by the subject’s age, gender, and prior listening experi- ence (see Figure 2). The program interactions between preferred bass and treble levels are expected due to vari- ability in the quality of music recordings; often they require adjustments in bass and treble on playback to restore a proper balance. Toole (2018) refers to these errors as audio’s “circle of confusion.” The confusion arises from not knowing the source of these errors: the recording, the loudspeaker, or its interaction with the room acoustics. The solution is a meaningful loud- speaker standard common to both the professional and consumer audio industries.
Female listeners preferred less bass and treble than their male counterparts. Younger and less experienced listeners
Spring 2022 • Acoustics Today 61
