
Page 63 - Spring2022
P. 63
A statistical method known as agglomerative hierarchical clustering exposed three different segments or classes of listeners based on similarities in their headphone pref- erences. By calculating the average response of the top five preferred headphones in each class, it was clear that the preferred bass level is the main feature that defines membership in a class. Class 1 includes most listeners (64%) who prefer headphones that closely comply with the Harman target. Class 2 listeners (15%) prefer the Harman target with 4-6 dB more bass. Class 3 listeners (21%) prefer the Harman target curve with 2 dB less bass.
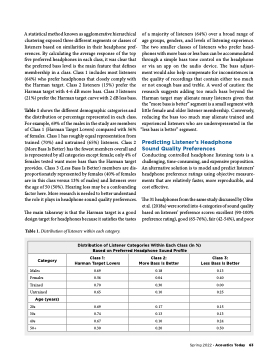
Table 1 shows the different demographic categories and the distribution or percentage represented in each class. For example, 69% of the males in the study are members of Class 1 (Harman Target Lovers) compared with 56% of females. Class 1 has roughly equal representation from trained (70%) and untrained (65%) listeners. Class 2 (More Bass Is Better) has the fewest members overall and is represented by all categories except female; only 4% of females tested want more bass than the Harman target provides. Class 3 (Less Bass Is Better) members are dis- proportionately represented by females (40% of females are in this class versus 13% of males) and listeners over the age of 50 (50%). Hearing loss may be a confounding factor here. More research is needed to better understand the role it plays in headphone sound quality preferences.
The main takeaway is that the Harman target is a good design target for headphones because it satisfies the tastes
Table 1. Distribution of listeners within each category.
of a majority of listeners (64%) over a broad range of age groups, genders, and levels of listening experience. The two smaller classes of listeners who prefer head- phones with more bass or less bass can be accommodated
through a simple bass tone control on the headphone or via an app on the audio device. The bass adjust- ment would also help compensate for inconsistences in the quality of recordings that contain either too much or not enough bass and treble. A word of caution: the research suggests adding too much bass beyond the Harman target may alienate many listeners given that the “more bass is better” segment is a small segment with little female and older listener membership. Conversely, reducing the bass too much may alienate trained and experienced listeners who are underrepresented in the
“less bass is better” segment.
Predicting Listener’s Headphone
Sound Quality Preferences
Conducting controlled headphone listening tests is a challenging, time-consuming, and expensive proposition. An alternative solution is to model and predict listeners’ headphone preference ratings using objective measure- ments that are relatively faster, more reproducible, and cost effective.
The 31 headphones from the same study discussed by Olive et al. (2018a) were sorted into 4 categories of sound quality based on listeners’ preference scores: excellent (90-100% preference rating), good (65-76%), fair (42-54%), and poor
Distribution of Listener Categories Within Each Class (in %) Based on Preferred Headphone Sound Profile
Category
Class 1: Harman Target Lovers
Class 2:
More Bass Is Better
Class 3:
Less Bass Is Better
Males
0.69
0.18
0.13
Females
0.56
0.04
0.40
Trained
0.70
0.30
0.00
Untrained
0.65
0.10
0.25
Age (years)
20s
0.69
0.17
0.15
30s
0.74
0.13
0.13
40s
0.67
0.10
0.24
50+
0.30
0.20
0.50
Spring 2022 • Acoustics Today 63
