
Page 64 - Spring2022
P. 64
HEADPHONE SOUND QUALITY
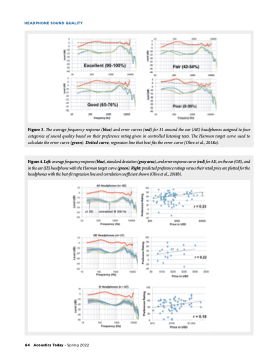
Figure 3. The average frequency response (blue) and error curves (red) for 31 around the ear (AE) headphones assigned to four categories of sound quality based on their preference rating given in controlled listening tests. The Harman target curve used to calculate the error curve (green). Dotted curve, regression line that best fits the error curve (Olive et al., 2018a).
Figure 4. Left: average frequency response (blue), standard deviation (gray area), and error response curve (red) for AE, on the ear (OE), and in the ear (IE) headphone with the Harman target curve (green). Right: predicted preference ratings versus their retail price are plotted for the headphones with the best-fit regression line and correlation coefficient shown (Olive et al., 2018b).
64 Acoustics Today • Spring 2022
