
Page 33 - Spring 2006
P. 33
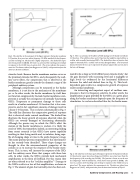
  Fig. 3. This is a summary of the effects of OHC damage on the basilar membrane I-O function. The solid line shows an I-O function that might be expected from a cochlea with normally functioning OHCs. The dashed line shows a function that might be obtained from a cochlea with severely damaged OHCs. The horizontal distance between the two curves represents the amount of gain that was lost due to the hair cell damage.
  Fig. 2. The solid line in the main part of the figure represents the basilar membrane I-O function for a pure tone whose frequency (10 kHz) matched the best frequen- cy of the recording site. The function is highly compressive. The dashed line repre- sents linear growth (1 dB/dB). The inset is a cartoon of the traveling wave envelope in response to the 10-kHz tone at a given level. The arrow indicates the measure- ment site. The data are taken from Ruggero et al. (1997), with permission from the American Institute of Physics.
 stimulus levels. Because basilar membrane motion serves as the proximal stimulus for IHCs, and subsequently the audi- tory nerve fibers, the compression that is observed at the basilar membrane greatly extends the dynamic range of the peripheral auditory system.
Although compression can be measured at the basilar membrane, it is not due to the mechanics of the membrane per se. In other words, the basilar membrane by itself does not function compressively. Instead, basilar membrane com- pression is actually the consequence of normally functioning OHCs. Temporary or permanent damage to those cells results in a basilar membrane I-O function that is less com- pressive, and in fact significant amounts of damage result in a linear I-O function. This is shown schematically in Fig. 3. The solid line illustrates the compressive growth of response that is observed under normal conditions. The dashed line illustrates the linear growth of response observed when the OHCs are severely damaged or functioning abnormally. Although the precise way in which the OHCs affect the motion of the basilar membrane is unclear, it is likely the result of OHC electromotility. Indeed, an interesting finding from recent research is that OHCs have motor capability resulting in their being motile and, in isolation, being capa- ble of changing shape at rates in the audio frequency range. The motor protein (prestin) responsible for this electromotil-
3
ity has recently been identified . These shape changes are
thought to alter the micromechanical properties of the cochlea so as to increase the response of the basilar mem- brane. This, in turn, will increase the response of the IHCs and the auditory nerve fibers that synapse with those hair cells. In other words, the OHCs provide local mechanical amplification in the form of feedback. For this reason they are often referred to as the “cochlear amplifier.”4 Damage to the OHCs results in a loss of that amplification, as shown in Fig. 3. The amount of gain that normally exists has been esti-
 mated to be as large as 50-80 dB for lower stimulus levels2, but the gain decreases with increasing level and is negligible at high levels (as evidenced by the horizontal difference between the solid and dashed lines in Fig. 3). This level- dependent gain results in a compressive growth of response under normal conditions.
An interesting and important aspect of cochlear com- pression is that it is frequency-selective. In other words, the amplification or gain provided by the OHCs at a given place along the basilar membrane depends upon the frequency of stimulation. As we have described thus far, the basilar mem-
  Fig. 4. The solid line in the main part of the figure represents the basilar membrane I-O function for a pure tone whose frequency (5 kHz) is one octave lower than the best frequency of the recording site (10 kHz). The function is linear, as can be seen by comparing it with the dashed line, which shows linear growth (1 dB/dB). The inset is a cartoon of the traveling wave envelope in response to the 5-kHz tone at a given level. The arrow indicates the measurement site. The data are taken from Ruggero et al. (1997), with permission from the American Institute of Physics.
Auditory Compression and Hearing Loss 31
