
Page 34 - Spring 2006
P. 34
brane response growth is normally highly compressive in response to a tone whose frequency is equal to the best fre- quency of the recording site (in Fig. 2, this was 10 kHz). However, in response to other input frequencies, the response growth at that same site may be less compressive or even linear. This is illustrated in Fig. 4, which shows the I-O function (solid line) at the 10-kHz place in response to a 5- kHz tone. The inset shows that the measurement site (indi- cated by the arrow) is basal to the peak of the traveling wave envelope. In this situation, the growth of response is linear (compare the I-O function with the linear reference shown by the dashed line). Had the measurements been taken at the 5-kHz place, where the traveling wave envelope peaks, the growth would have been compressive in response to the 5- kHz tone. Thus each place along the basilar membrane will exhibit a compressive growth of response, but only for tones with a frequency near the frequency of the measurement site.
Some perceptual consequences of normal and reduced cochlear compression
We began this article by describing the incredibly large dynamic range of human hearing, and indicated that it was due to a form of amplitude compression in the inner ear. It should now be clear that the cochlear compression described in the previous section is largely responsible for this dynam- ic range. We will now explore this further and consider some of the other perceptual consequences of cochlear compres- sion. In addition, we will highlight the consequences of reduced (or absent) compression in individuals with a hear- ing loss involving damage to the OHCs. Although not all hearing losses result from such damage, most sensorineural losses involve at least some damage to those sensory cells.
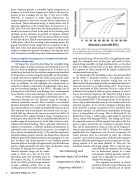
When the OHCs are damaged in individuals with a sen- sorineural hearing loss, the dynamic range of hearing is reduced, sometimes severely. This is manifest as an elevated absolute threshold (this is typically what defines a hearing loss) and usually an unchanged uncomfortable loudness level. (For someone with a hearing loss, the bottom curve in Fig. 1 would shift up, whereas the top curve would not shift.) In individuals with a reduced dynamic range, the loudness of a sound goes from relatively soft to uncomfortably loud over a smaller range of sound pressure levels than it does in indi- viduals with normal hearing. This is generally referred to as loudness recruitment, a relatively common phenomenon in individuals with sensorineural hearing loss. An example of this is shown schematically in Fig. 5. The solid line represents normal loudness growth, whereas the dashed lines represent loudness growth for different amounts of hearing loss. As the loss increases, the initial portion of the loudness growth function shifts to the right (to higher levels), but all functions meet at a high sound pressure level. Thus, the dynamic range decreases as hearing loss increases. The
reduced dynamic range can be under- stood in terms of a loss of the level- dependent gain that normally exists in the cochlea (see Fig. 3). At low stimulus levels, the OHCs provide large amounts of gain, enabling sounds such as the rustling leaves to be heard by individuals
with normal hearing. When the OHCs are significantly dam- aged, the subsequent loss of that gain will result in those sounds being inaudible. At high stimulus levels, on the other hand, the OHCs provide little or no gain anyway, and thus the response to those sounds will be largely unaffected by sensorineural hearing loss.
As discussed in the preceding section, the gain provided by the OHCs is frequency-selective. An important conse- quence of this is a rather exquisite tuning that can be observed in both physiological and psychophysical measures. One such measure is a so-called tuning curve. These curves can be envisioned as filter functions: they are a plot of the stimulus level needed to achieve a given response as a func- tion of the stimulus frequency. The solid line in Fig. 6 shows a tuning curve that might be expected from an auditory sys- tem with normal OHCs. The tuning is sharp. At the tip of the curve, only a small sound pressure level is needed to elicit the criterion response. As the stimulus frequency diverges from there, however, a greater and greater level is needed to elicit that same response. An unfortunate consequence of hearing loss is a degradation of tuning. This is illustrated by the dashed line in Fig. 6, which shows what might be expected from a system with damaged OHCs. The tuning curve from the impaired system is shifted upward, but only in the fre- quency region around the tip, resulting in broader tuning. This can be understood in terms of a loss of the frequency- selective gain provided by the OHCs. Without the cochlear amplification for frequencies near the best frequency, the sound pressure must be increased to elicit the criterion response. A perceptual consequence of this broader tuning is a greater difficulty processing sound in the presence of com- peting sounds—it is just more difficult to “filter out” the unwanted sounds with broad tuning. Thus, it may be espe-
cially difficult for someone with hearing loss to understand speech in a noisy environment. Indeed, and most unfortu- nately, this is typically the case for indi- viduals with hearing loss.
Our exquisite sensitivity to sound, enormous dynamic range of hearing, and fine frequency resolution are all closely
“An interesting and important aspect of cochlear compression is that it is frequency-selective.”
Fig. 5. The solid line shows how perceived loudness grows as a function of stimulus level in individuals with normal hearing. The dashed lines show loudness growth for individuals with different amounts of hearing loss.
32 Acoustics Today, April 2006
